Sysco 2013 Annual Report Download - page 41
Download and view the complete annual report
Please find page 41 of the 2013 Sysco annual report below. You can navigate through the pages in the report by either clicking on the pages listed below, or by using the keyword search tool below to find specific information within the annual report.-
 1
1 -
2
-
3
-
4
-
5
-
6
-
7
-
8
-
9
-
10
-
11
-
12
-
13
-
14
-
15
-
16
-
17
-
18
-
19
-
20
-
21
-
22
-
23
-
24
-
25
-
26
-
27
-
28
-
29
-
30
-
 31
31 -
 32
32 -
 33
33 -
 34
34 -
 35
35 -
 36
36 -
 37
37 -
 38
38 -
 39
39 -
 40
40 -
 41
41 -
 42
42 -
 43
43 -
 44
44 -
 45
45 -
 46
46 -
 47
47 -
 48
48 -
 49
49 -
 50
50 -
 51
51 -
52
-
53
-
54
-
55
-
56
-
57
-
58
-
59
-
60
-
61
-
62
-
63
-
64
-
65
-
66
-
67
-
68
-
69
-
70
-
71
-
72
-
73
-
74
-
75
-
76
-
77
-
78
-
79
-
80
-
81
-
82
-
83
-
84
-
85
-
86
-
87
-
88
-
89
-
90
-
91
-
92
-
93
-
94
-
95
-
96
-
97
-
98
-
99
-
100
-
101
 |
 |

SYSCO CORPORATION-Form10-K30
PARTII
ITEM7Management’s Discussion and Analysis ofFinancial Condition and Results of Operations
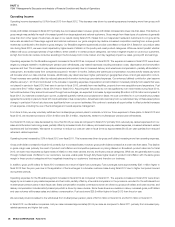
Liquidity and Capital Resources
Highlights
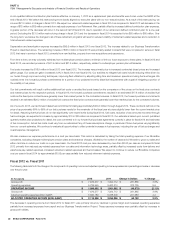
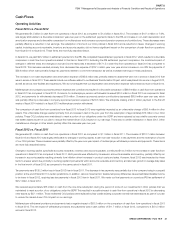
Comparisons of the cash ows from scal 2013 to scal 2012:
•Cash ows from operations were $1.5billion this year compared to $1.4billion last year.
•Settlement payments to the Internal Revenue Service (IRS) were zero this year compared to $212.0million last year.
•Capital expenditures totaled $511.9million this year compared to $784.5million last year.
•
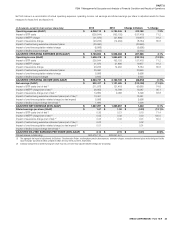
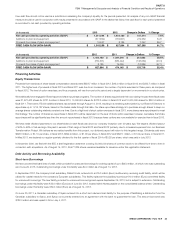
Free cash ow was $1.0billion this year compared to $627.9million last year (See Non-GAAP reconciliation below under the heading “Free Cash Flow.”)
•Cash ows for acquisition of businesses were $397.4million this year compared to $110.6million last year.
•Net bank borrowings were a net borrowing of $95.5million this year compared to a net repayment of $182.0million last year.
•Proceeds from exercises of share-based compensation awards was $628.7million this year compared to $99.4million last year.
•Treasury stock purchases were $721.6million this year compared to $272.3million last year.
•Dividends paid were $648.3million this year compared to $622.9million last year.
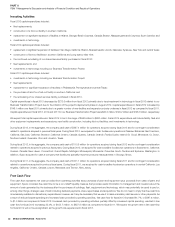
Sources and Uses of Cash
Sysco’s strategic objectives include continuous investment in our business; these investments are funded by a combination of cash from operations and access
to capital from nancial markets. Our operations historically have produced signi cant cash ow. Cash generated from operations is generally allocated to:
•working capital requirements;
•investments in facilities, systems, eet, other equipment and technology;
•return of capital to shareholders, including cash dividends and share repurchases;
•acquisitions compatible with our overall growth strategy;
•contributions to our various retirement plans; and
•debt repayments.
Any remaining cash generated from operations may be invested in high-quality, short-term instruments. As a part of our ongoing strategic analysis,
we regularly evaluate business opportunities, including potential acquisitions and sales of assets and businesses, and our overall capital structure. Any
transactions resulting from these evaluations may materially impact our liquidity, borrowing capacity, leverage ratios and capital availability.
We continue to generate substantial cash ows from operations and remain in a strong nancial position, however our liquidity and capital resources can
be in uenced by economic trends and conditions that impact our results of operations. Uncertain economic conditions and uneven levels of consumer
con dence and the resulting pressure on consumer disposable income have lowered our sales growth and impacted our cash ows from operations.
Competitive pressures in a low growth environment have also lowered our gross margins which in turn can cause our cash ows from operations to
decrease. We believe our mechanisms to manage working capital, such as credit monitoring, optimizing inventory levels and maximizing payment terms
with vendors, and our mechanisms to manage the items impacting our gross pro ts have been suf cient to limit a signi cant unfavorable impact on our
cash ows from operations. We believe these mechanisms will continue prevent a signi cant unfavorable impact on our cash ows from operations. As
of June29,2013, we had $412.3million in cash and cash equivalents, approximately 27% of which was held by our international subsidiaries generated
from our earnings of international operations. If these earnings were transferred among countries or repatriated to the UnitedStates, such amounts may
be subject to additional tax obligations; however, we do not currently anticipate the need to relocate this cash.
We believe the following sources will be suf cient to meet our anticipated cash requirements for the next twelve months, while maintaining suf cient liquidity for
normal operating purposes:
•our cash ows from operations;
•the availability of additional capital under our existing commercial paper programs, supported by our revolving credit facility, and bank lines of credit;
•our ability to access capital from nancial markets, including issuances of debt securities, either privately or under our shelf registration statement led
with the Securities and Exchange Commission (SEC).
Due to our strong nancial position, we believe that we will continue to be able to effectively access the commercial paper market and long-term capital
markets, if necessary. We believe our cash ows from operations will improve over the long-term due to bene ts from our Business Transformation Project
and initiatives to improve our working capital management.