Sysco 2013 Annual Report Download - page 38
Download and view the complete annual report
Please find page 38 of the 2013 Sysco annual report below. You can navigate through the pages in the report by either clicking on the pages listed below, or by using the keyword search tool below to find specific information within the annual report.-
 1
1 -
2
-
3
-
4
-
5
-
6
-
7
-
8
-
9
-
10
-
11
-
12
-
13
-
14
-
15
-
16
-
17
-
18
-
19
-
20
-
21
-
22
-
23
-
24
-
25
-
26
-
27
-
 28
28 -
 29
29 -
 30
30 -
 31
31 -
 32
32 -
 33
33 -
 34
34 -
 35
35 -
 36
36 -
 37
37 -
 38
38 -
 39
39 -
 40
40 -
 41
41 -
 42
42 -
 43
43 -
 44
44 -
 45
45 -
 46
46 -
 47
47 -
 48
48 -
49
-
50
-
51
-
52
-
53
-
54
-
55
-
56
-
57
-
58
-
59
-
60
-
61
-
62
-
63
-
64
-
65
-
66
-
67
-
68
-
69
-
70
-
71
-
72
-
73
-
74
-
75
-
76
-
77
-
78
-
79
-
80
-
81
-
82
-
83
-
84
-
85
-
86
-
87
-
88
-
89
-
90
-
91
-
92
-
93
-
94
-
95
-
96
-
97
-
98
-
99
-
100
-
101
 |
 |

SYSCO CORPORATION-Form10-K 27
PARTII
ITEM7Management’s Discussion and Analysis ofFinancial Condition and Results of Operations
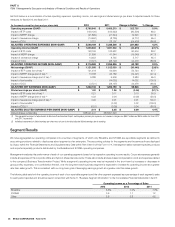
The following table sets forth the change in the selected nancial data of each of our reportable segments and the other segment expressed as a percentage
increase over the prior year and should be read in conjunction with Note21, “Business Segment Information” to the Consolidated Financial Statements in Item8:
2013 2012
Sales Operating
Income Sales Operating
Income
Broadline 5.0% (0.6)% 7.8% 3.8%
SYGMA 0.8 (14.7)(1) 7.4 (2.0)(1)
Other 14.4 8.3 7.0 (9.2)
(1) SYGMA had operating income of $52.0million in fiscal 2013, $61.0million in fiscal 2012 and $62.2million in fiscal 2011.
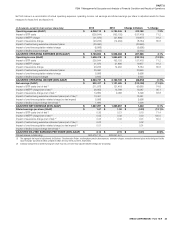
The following table sets forth sales and operating income of each of our reportable segments, the other segment, and intersegment sales, expressed as a
percentage of aggregate segment sales, including intersegment sales, and operating income, respectively. For purposes of this statistical table, operating income
of our segments excludes corporate expenses of $894.3million in scal 2013, $677.6million in scal 2012 and $558.8million in scal 2011 that are not charged
to our segments. This information should be read in conjunction with Note21, “Business Segment Information” to the Consolidated Financial Statements in Item8:
2013 2012 2011
Sales
Segment
Operating
Income Sales
Segment
Operating
Income Sales
Segment
Operating
Income
Broadline 81.3% 94.1% 81.2% 94.1% 81.2% 93.5%
SYGMA 13.0 2.0 13.5 2.4 13.6 2.5
Other 6.2 3.9 5.7 3.5 5.7 4.0
Intersegment sales (0.5) - (0.4) - (0.5) -
TOTAL 100.0% 100.0% 100.0% 100.0% 100.0% 100.0%
Broadline Segment
The Broadline reportable segment is an aggregation of the company’s UnitedStates, Canadian,Caribbean and European Broadline segments. Broadline
operating companies distribute a full line of food products and a wide variety of non-food products to both traditional and chain restaurant customers,
hospitals, schools, hotels, industrial caterers and other venues where foodservice products are served. These companies also provide custom-cut meat
operations. Broadline operations have signi cantly higher operating margins than the rest of Sysco’s operations. In scal 2013, the Broadline operating
results represented approximately 81.3% of Sysco’s overall sales and 94.1% of the aggregate operating income of Sysco’s segments, which excludes
corporate expenses.
There are several factors which contribute to these higher operating results as compared to the SYGMA and Other operating segments. We have invested
substantial amounts in assets, operating methods, technology and management expertise in this segment. The breadth of its sales force, geographic reach
of its distribution area and its purchasing power allow us to bene t from this segment’s earnings.
Sales
Sales were 5.0% greater in scal 2013 than scal 2012. Sales for scal 2013 increased as a result of product cost in ation and the resulting increase in
selling prices, sales from acquisitions that occurred within the last 12months and improving case volumes. Our sales growth in scal 2013 has been greater
with our large regional and national customersas compared to sales growth with our independent restaurant customers. We believe our independent sales
growth has been negatively in uenced by lower consumer sentiment. Sales from acquisitions within the last 12months contributed 1.6% to the overall
sales comparison for scal 2013. Our acquisition activity has been greater in scal 2013 as compared to scal 2012. We estimate the carryover impact into
scal 2014 will cause sales to increase by approximately 1.0%. We expect to continue at the trend of closing acquisitions in scal 2014 that will continue
to add annualized sales from new acquisitions in scal 2014. Changes in product costs, an internal measure of in ation or de ation, were estimated as
in ation of 2.3% in scal 2013. The changes in the exchange rates used to translate our foreign sales into U.S. dollars did not have a signi cant impacton
sales when compared to scal 2012.
Sales for scal 2012 were 7.8% greater than scal 2011. Product cost in ation and the resulting increase in selling prices, combined with case volume
improvement, contributed to the increase in sales in scal 2012. Changes in product costs, an internal measure of in ation or de ation, were estimated as
in ation of 5.7% in scal 2012. Non-comparable acquisitions contributed 0.7% to the overall sales comparison for scal 2012. The changes in the exchange
rates used to translate our foreign sales into U.S. dollars negatively impacted sales by 0.1% compared to scal 2011.