Sysco 2013 Annual Report Download - page 94
Download and view the complete annual report
Please find page 94 of the 2013 Sysco annual report below. You can navigate through the pages in the report by either clicking on the pages listed below, or by using the keyword search tool below to find specific information within the annual report.-
 1
1 -
2
-
3
-
4
-
5
-
6
-
7
-
8
-
9
-
10
-
11
-
12
-
13
-
14
-
15
-
16
-
17
-
18
-
19
-
20
-
21
-
22
-
23
-
24
-
25
-
26
-
27
-
28
-
29
-
30
-
31
-
32
-
33
-
34
-
35
-
36
-
37
-
38
-
39
-
40
-
41
-
42
-
43
-
44
-
45
-
46
-
47
-
48
-
49
-
50
-
51
-
52
-
53
-
54
-
55
-
56
-
57
-
58
-
59
-
60
-
61
-
62
-
63
-
64
-
65
-
66
-
67
-
68
-
69
-
70
-
71
-
72
-
73
-
74
-
75
-
76
-
77
-
78
-
79
-
80
-
81
-
82
-
83
-
 84
84 -
 85
85 -
 86
86 -
 87
87 -
 88
88 -
 89
89 -
 90
90 -
 91
91 -
 92
92 -
 93
93 -
 94
94 -
 95
95 -
 96
96 -
 97
97 -
 98
98 -
 99
99 -
 100
100 -
 101
101
 |
 |

SYSCO CORPORATION-Form10-K 83
PARTII
ITEM8Financial Statements and Supplementary Data
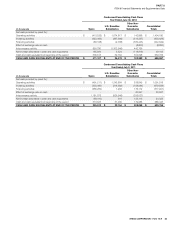
(Inthousands)
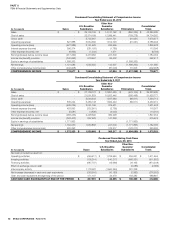
Condensed Consolidating Cash Flows
Year Ended June30,2012
Sysco U.S. Broadline
Subsidiaries
Other Non-
Guarantor
Subsidiaries Consolidated
Totals
Net cash provided by (used for):
Operating activities $ (413,535) $ 1,674,817 $ 142,898 $ 1,404,180
Investing activities (222,483) (367,909) (313,237) (903,629)
Financing activities (58,168) (2,038) (382,443) (442,649)
Effect of exchange rate on cash - - (8,800) (8,800)
Intercompany activity 859,780 (1,302,546) 442,766 -
Net increase (decrease) in cash and cash equivalents 165,594 2,324 (118,816) 49,102
Cash and cash equivalents at beginning of the period 305,513 32,154 302,098 639,765
CASH AND CASH EQUIVALENTS AT END OF THE PERIOD $ 471,107 $ 34,478 $ 183,282 $ 688,867
(Inthousands)
Condensed Consolidating Cash Flows
Year Ended July2,2011
Sysco U.S. Broadline
Subsidiaries
Other Non-
Guarantor
Subsidiaries Consolidated
Totals
Net cash provided by (used for):
Operating activities $ (491,211) $ 1,243,884 $ 338,845 $ 1,091,518
Investing activities (203,090) (318,382) (158,084) (679,556)
Financing activities (555,282) 1,263 176,112 (377,907)
Effect of exchange rate on cash - - 20,267 20,267
Intercompany activity 1,181,573 (926,546) (255,027) -
Net increase (decrease) in cash and cash equivalents (68,010) 219 122,113 54,322
Cash and cash equivalents at beginning of the period 373,523 31,935 179,985 585,443
CASH AND CASH EQUIVALENTS AT END OF THE PERIOD $ 305,513 $ 32,154 $ 302,098 $ 639,765