Sysco 2013 Annual Report Download - page 82
Download and view the complete annual report
Please find page 82 of the 2013 Sysco annual report below. You can navigate through the pages in the report by either clicking on the pages listed below, or by using the keyword search tool below to find specific information within the annual report.-
 1
1 -
2
-
3
-
4
-
5
-
6
-
7
-
8
-
9
-
10
-
11
-
12
-
13
-
14
-
15
-
16
-
17
-
18
-
19
-
20
-
21
-
22
-
23
-
24
-
25
-
26
-
27
-
28
-
29
-
30
-
31
-
32
-
33
-
34
-
35
-
36
-
37
-
38
-
39
-
40
-
41
-
42
-
43
-
44
-
45
-
46
-
47
-
48
-
49
-
50
-
51
-
52
-
53
-
54
-
55
-
56
-
57
-
58
-
59
-
60
-
61
-
62
-
63
-
64
-
65
-
66
-
67
-
68
-
69
-
70
-
71
-
 72
72 -
 73
73 -
 74
74 -
 75
75 -
 76
76 -
 77
77 -
 78
78 -
 79
79 -
 80
80 -
 81
81 -
 82
82 -
 83
83 -
 84
84 -
 85
85 -
 86
86 -
 87
87 -
 88
88 -
 89
89 -
 90
90 -
 91
91 -
 92
92 -
93
-
94
-
95
-
96
-
97
-
98
-
99
-
100
-
101
 |
 |

SYSCO CORPORATION-Form10-K 71
PARTII
ITEM8Financial Statements and Supplementary Data
Other Postretirement Benefi t Plans
In addition to the contributions to the de ned bene t pension plans described above, Sysco also contributes to several multiemployer plans that provide
other postretirement bene ts based on obligations arising under collective bargaining agreements covering union-represented employees. These plans may
provide medical, pharmacy, dental, vision, mental health and other bene ts to active employees and retirees as determined by the trustees of each plan.
Sysco contributed to these plans $30.6million in scal 2013, $25.5million in scal 2012 and $23.9million in scal 2011. There have been no signi cant
changes that affect the comparability of scal 2013, scal 2012 and scal 2011 contributions.
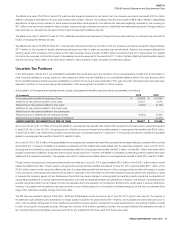
NOTE15 Earnings Per Share
Basic earnings per share has been computed by dividing net earnings by the weighted average number ofshares of common stock outstanding for
each respective year. Diluted earnings per share has been computed by dividing net earnings by the weighted average number ofshares of common
stock outstanding during those respective years adjusted for the dilutive effect of share-based awards outstanding using the treasury stock method. The
two-class method is also utilized for the computation of earnings per share. The two-class method requires a portion of net income to be allocated to
participating securities, which are unvested awards of share-based compensation with non-forfeitable rights to receive dividends or dividend equivalents,
if declared. Net earnings allocated to these participating securities are excluded from net earnings allocated to commonshares and were insigni cant in
scal 2013,2012 and 2011.
A reconciliation of the numerators and the denominators of the basic and diluted earnings per share computations for the periods presented follows:
(Inthousands, except for share and per share data)
2013 2012 2011
Numerator:
Net earnings $ 992,427 $ 1,121,585 $ 1,152,030
Denominator:
Weighted-average basicshares outstanding 589,397,807 587,726,343 586,526,142
Dilutive effect of share-based awards 3,277,303 1,265,098 2,165,404
Weighted-average dilutedshares outstanding 592,675,110 588,991,441 588,691,546
BASIC EARNINGS PER SHARE: $ 1.68 $ 1.91 $ 1.96
DILUTED EARNINGS PER SHARE: $ 1.67 $ 1.90 $ 1.96
The number of options that were not included in the diluted earnings per share calculation because the effect would have been anti-dilutive was approximately
18,200,000,49,100,000 and 50,700,000 for scal 2013,2012 and 2011, respectively.
Dividends declared were $654.9million, $628.0million and $604.5million in scal 2013,2012 and 2011, respectively. Included in dividends declared for
each year were dividends declared but not yet paid at year-end of approximately $165.8million, $159.4million and $155.0million in scal 2013,2012
and 2011, respectively.
NOTE16 Comprehensive Income
Comprehensive income is net earnings plus certain other items that are recorded directly to shareholders’ equity, such as foreign currency translation
adjustments, amounts related to cash ow hedging arrangements and certain amounts related to pension and other postretirement plans. Comprehensive
income was $1,208.4million, $718.7million and $1,372.3million in scal 2013,2012 and 2011, respectively.
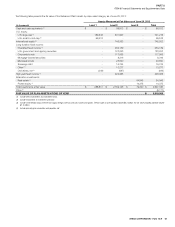
A summary of the components of other comprehensive income (loss) and the related tax effects for each of the years presented is as follows:
(Inthousands)
2013
Before Tax
Amount Tax Net of Tax
Amount
Foreign currency translation adjustment $ (33,191) $ - $ (33,191)
Amortization of cash ow hedges 626 240 386
Amortization of prior service cost 18,360 7,050 11,310
Amortization of actuarial loss (gain), net 72,421 27,811 44,610
Amortization of transition obligation 141 53 88
Prior service cost arising in current year (53,902) (20,699) (33,203)
Actuarial gain (loss), net arising in current year 366,769 140,840 225,929
TOTAL OTHER COMPREHENSIVE INCOME (LOSS) $ 371,224 $ 155,295 $ 215,929