Sysco 2013 Annual Report Download - page 85
Download and view the complete annual report
Please find page 85 of the 2013 Sysco annual report below. You can navigate through the pages in the report by either clicking on the pages listed below, or by using the keyword search tool below to find specific information within the annual report.-
 1
1 -
2
-
3
-
4
-
5
-
6
-
7
-
8
-
9
-
10
-
11
-
12
-
13
-
14
-
15
-
16
-
17
-
18
-
19
-
20
-
21
-
22
-
23
-
24
-
25
-
26
-
27
-
28
-
29
-
30
-
31
-
32
-
33
-
34
-
35
-
36
-
37
-
38
-
39
-
40
-
41
-
42
-
43
-
44
-
45
-
46
-
47
-
48
-
49
-
50
-
51
-
52
-
53
-
54
-
55
-
56
-
57
-
58
-
59
-
60
-
61
-
62
-
63
-
64
-
65
-
66
-
67
-
68
-
69
-
70
-
71
-
72
-
73
-
74
-
 75
75 -
 76
76 -
 77
77 -
 78
78 -
 79
79 -
 80
80 -
 81
81 -
 82
82 -
 83
83 -
 84
84 -
 85
85 -
 86
86 -
 87
87 -
 88
88 -
 89
89 -
 90
90 -
 91
91 -
 92
92 -
 93
93 -
 94
94 -
 95
95 -
96
-
97
-
98
-
99
-
100
-
101
 |
 |
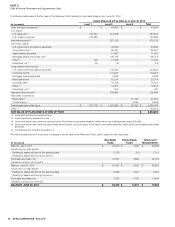
SYSCO CORPORATION-Form10-K74
PARTII
ITEM8Financial Statements and Supplementary Data
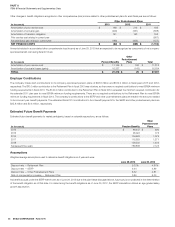
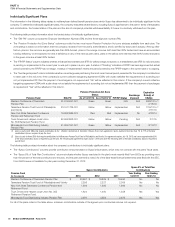
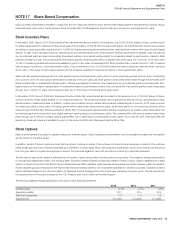
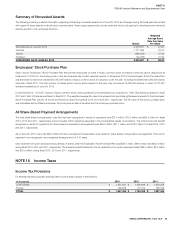
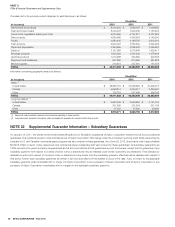
The following summary presents information regarding outstanding options as of June29,2013 and changes during the scal year then ended with regard to
options under all stock incentive plans:
Shares Under
Option
Weighted
Average
Exercise Price
Per Share
Weighted
Average
Remaining
Contractual
Term (in years)
Aggregate
Intrinsic Value
(inthousands)
Outstanding as of June30,2012 59,224,226 $ 29.85
Granted 6,212,716 29.96
Exercised (20,916,611) 30.19
Forfeited (653,616) 28.19
Expired (12,309,926) 31.42
OUTSTANDING AS OF JUNE29,2013 31,556,789 $ 29.07 3.84 $ 160,756
VESTED OR EXPECTED TO VEST AS OF JUNE29,2013 31,255,012 $ 29.07 3.83 $ 159,125
EXERCISABLE AS OF JUNE29,2013 11,546,717 $ 30.19 2.15 $ 45,866
The total number of employee options granted was 6,212,716, 7,015,952 and 7,190,250 in scal years 2013,2012 and 2011, respectively. During scal
2013, 2,351,720 options were granted to 11 executive of cers and 3,860,996 options were granted to approximately 152 other key employees. During
scal 2012, 2,898,854 options were granted to 11 executive of cers and 4,117,098 options were granted to approximately 180 other key employees. During
scal 2011, 1,423,000 options were granted to 11 executive of cers and 5,767,250 options were granted to approximately 1,500 other key employees.
The weighted average grant-date fair value of options granted in scal 2013,2012 and 2011 was $3.20, $3.69 and $3.96, respectively. The total intrinsic
value of options exercised during scal 2013,2012 and 2011 was $24.1million, $8.3million and $45.5million, respectively.
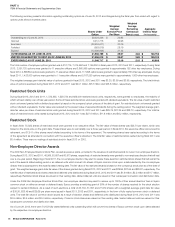
Restricted Stock Units
During scal 2013,2012 and 2011, 1,722,835, 1,528,734 and 656,000 restricted stock units, respectively, were granted to employees, the majority of
which will vest ratably over a three-year period. Some of these restricted stock units were granted with dividend equivalents. The fair value of each restricted
stock unit award granted with a dividend equivalent is based on the company’s stock price as of the date of grant. For restricted stock unit awards granted
without dividend equivalents, the fair value was reduced by the present value of expected dividends during the vesting period. The weighted average grant-
date fair value per share of restricted stock units granted during scal 2013,2012 and 2011 was $29.75, $27.35 and $28.72, respectively. The total fair
value of restricted stock unitsvested during scal 2013,2012 and2011 was $27.6million, $11.8million and $6.2million, respectively.
Restricted Stock
In scal 2009, 75,822shares of restricted stock were granted to an executive of cer. The fair value of theseshares was $23.74 per share, which was
based on the stock price on the grant date. Theseshares were to vest ratably over a three-year period. In scal 2010, this executive of cer announced his
retirement, and 37,911 of theshares were forfeited according to the terms of the agreement. The remainingshares have vested according to the terms
of the agreement as amended in connection with the executive of cer’s retirement. The total fair value of restricted stock vested during scal 2011 was
$0.4million. There were no vestings of restricted stock in scal 2013 or 2012.
Non-Employee Director Awards
The 2009 Non-Employee Directors Stock Plan, as well as previous plans, provides for the issuance of restricted awards to current non-employee directors.
During scal 2013,2012 and 2011, 48,069, 63,657 and 60,973shares, respectively, of restricted awards were granted to non-employee directors that will vest
over a one-year period. Beginning in scal 2011, the non-employee directors may elect to receive these awards in restricted stockshares that will vest at the
end of the award’s stated vesting period or as deferred units which convert intoshares of Sysco common stock upon a date selected by the non-employee
director that is subsequent to the award’s stated vesting date. The fair value of the restricted awards is based on the company’s stock price as of the date of
grant. The weighted average grant-date fair value of theshares granted during scal 2013,2012 and 2011 was $29.96, $27.65 and $28.87, respectively. The
total fair value of restricted stockshares vested and deferred units distributed during scal 2013,2012 and 2011 was $1.9million, $2.2million and $1.7million,
respectively. Restricted stockshares are valued on their vesting date. Vested deferred units are valued on their subsequent conversion and distribution date.
Under the 2009 Non-Employee Directors Stock Plan, non-employee directors may elect to receive up to 100% of their annual directors’ fees in Sysco
common stock on either an annual or deferred basis. Sysco provides a matching grant of 50% of the number ofshares received for the stock election
subject to certain limitations. As a result of such elections, a total of 26,702, 31,397 and 27,979shares with a weighted-average grant date fair value
of $30.38, $28.46 and $29.26 per share were issued in scal 2013,2012 and 2011, respectively, in the form of fully vested common stock or deferred
units. The total fair value of common stock issued as a result of electionshares and deferred units distributed during scal 2013,2012 and 2011 was
$0.5million, $0.5million and $0.4million, respectively. Common stockshares are valued on their vesting date. Vested deferred units are valued on their
subsequent conversion and distribution date.
As of June29,2013, there were 74,153 fully vested deferred units outstanding which will convert intoshares of Sysco common stock upon dates selected
by the respective non-employee directors.