Sysco 2013 Annual Report Download - page 42
Download and view the complete annual report
Please find page 42 of the 2013 Sysco annual report below. You can navigate through the pages in the report by either clicking on the pages listed below, or by using the keyword search tool below to find specific information within the annual report.-
 1
1 -
2
-
3
-
4
-
5
-
6
-
7
-
8
-
9
-
10
-
11
-
12
-
13
-
14
-
15
-
16
-
17
-
18
-
19
-
20
-
21
-
22
-
23
-
24
-
25
-
26
-
27
-
28
-
29
-
30
-
31
-
 32
32 -
 33
33 -
 34
34 -
 35
35 -
 36
36 -
 37
37 -
 38
38 -
 39
39 -
 40
40 -
 41
41 -
 42
42 -
 43
43 -
 44
44 -
 45
45 -
 46
46 -
 47
47 -
 48
48 -
 49
49 -
 50
50 -
 51
51 -
 52
52 -
53
-
54
-
55
-
56
-
57
-
58
-
59
-
60
-
61
-
62
-
63
-
64
-
65
-
66
-
67
-
68
-
69
-
70
-
71
-
72
-
73
-
74
-
75
-
76
-
77
-
78
-
79
-
80
-
81
-
82
-
83
-
84
-
85
-
86
-
87
-
88
-
89
-
90
-
91
-
92
-
93
-
94
-
95
-
96
-
97
-
98
-
99
-
100
-
101
 |
 |
SYSCO CORPORATION-Form10-K 31
PARTII
ITEM7Management’s Discussion and Analysis ofFinancial Condition and Results of Operations
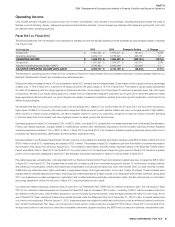
Cash Flows
Operating Activities
Fiscal 2013 vs. Fiscal 2012
We generated $1.5billion in cash ow from operations in scal 2013, as compared to $1.4billion in scal 2012. The increase of $107.4million or 7.6%,
was largely attributable to a favorable comparison year-over-year on the settlement payments made to the IRS, an increase in non-cash depreciation and
amortization expense and a favorable comparison for multiemployer and company-sponsored pension expense and contributions. These decreases were
partially offset by a reduction in net earnings, the redemption of some of our COLI policies in scal 2012 and a reduction in taxes. Changes in working
capital, including accounts receivable, inventory and accounts payable, did not have a signi cant impact on the comparison of cash ow from operations
from scal 2013 to scal 2012. These items are more fully described below.
In scal 2012, we paid $212million in settlement payments to the IRS. We completed these settlement payments in scal 2012, which resulted in a favorable
comparison in cash ow from operations related to this item in scal 2013. Excluding the IRS settlement payment comparison, the combined impact of
changes in deferred taxes and changes in accrued income taxes was a decrease of $171.5 in cash ow from operations in scal 2013 as compared to
scal 2012. This decrease resulted primarily from decreased tax expense of $107.4million year over year and an increase in non-IRS tax payments of
$59.6million which were primarily foreign tax payments related to a one-time transaction as well as increased earnings in these jurisdictions.
The increase in non-cash depreciation and amortization expense of $95.6million was primarily related to assets that were not in service in scal 2012 that
were in service in scal 2013. These assets include our software related to our Business Transformation Project, which was placed into service in August2012,
as well as various new facilities and expansions. We do not anticipate that our depreciation and amortization expense will increase as much in scal 2014.
Multiemployer and company-sponsored pension expense and contributions resulted in a favorable comparison of $69.9million in cash ow from operations
in scal 2013 as compared to scal 2012. Provisions for multiemployer pension withdrawals increased $20.0million in scal 2013 as compared to scal
2012, and payments for withdrawals decreased $1.8million. Company-sponsored pension contributions decreased $68.9million year over year, which
was partially offset by a decrease in company-sponsored pension expense of $20.8million. We anticipate making a $40.7million payment in the rst 26
weeks of scal 2014 related to a scal 2013 multiemployer pension withdrawal.
The comparison of cash ow from operations from scal 2013 to scal 2012 was negatively impacted by an unfavorable change of $56.4million in other
assets. This unfavorable change resulted primarily from an increase in cash in the prior year from the redemption of approximately $75million of our COLI
policies. These COLI policies were maintained to meet a portion of our obligations under the SERP and were replaced by less volatile corporate-owned
real estate assets as part of our plan to reduce the market-driven COLI impact on our earnings. There was no similar redemption in scal 2013. Other
miscellaneous changes in other assets partially offset this decrease year over year.
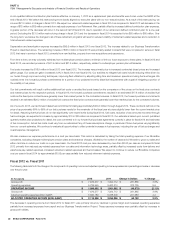
Fiscal 2012 vs. Fiscal 2011
We generated $1.4billion in cash ow from operations in scal 2012, as compared to $1.1billion in scal 2011. The increase of $312.7million between
scal 2013 and scal 2012 was largely attributable to changes in working capital, a year-over-year reduction in tax payments and the redemption of some
of our COLI policies. These increases were partially offset by the year-over-year impact of multiemployer withdrawal provisions and payments. These items
are more fully described below.
Changes in working capital, speci cally accounts receivable, inventory and accounts payable, contributed $144.3million to the increase in cash ow from
operations in scal 2012 as compared to scal 2011. Both periods were affected by increases in accounts receivable and inventory, partially offset by an
increase in accounts payable resulting primarily from in ation-driven increases in product costs and sales. However, scal 2012 was impacted by these
items to a lesser extent due primarily to working capital improvements within accounts receivable and inventory and also less growth in average daily sales
in the nal month of scal 2012 as compared to the same period in scal 2011.
Tax payments were $135.2million less in scal 2012 than in scal 2011. The decrease in tax payments was partially due to the company being in a prepaid
position at the end of scal 2011 in certain jurisdictions. In addition, various movements in taxable temporary differences caused estimated taxable income
to be lower in scal 2012, requiring less tax payments in scal 2012 than in scal 2011. We made our nal payments on a previous IRS tax settlement of
$212million in scal 2012.
We received approximately $75million in cash from the one-time redemption during the period of some of our investments in COLI policies that we
maintained to meet a portion of our obligations under the SERP. This resulted in a positive impact to cash ow from operations in scal 2012 by decreasing
other assets by $57.1million. Those redeemed COLI policies were replaced by less volatile existing corporate-owned real estate assets as part of our plan
to reduce the market-driven COLI impact on our earnings.
Multiemployer withdrawal provisions and payments had a negative impact of $53.3million on the comparison of cash ow from operations in scal 2013
to scal 2012. The net impact of withdrawal provisions and payments was a cash out ow of $11.7million in scal 2012, compared to a $41.5million
accrual in scal 2012.