Sysco 2013 Annual Report Download - page 92
Download and view the complete annual report
Please find page 92 of the 2013 Sysco annual report below. You can navigate through the pages in the report by either clicking on the pages listed below, or by using the keyword search tool below to find specific information within the annual report.-
 1
1 -
2
-
3
-
4
-
5
-
6
-
7
-
8
-
9
-
10
-
11
-
12
-
13
-
14
-
15
-
16
-
17
-
18
-
19
-
20
-
21
-
22
-
23
-
24
-
25
-
26
-
27
-
28
-
29
-
30
-
31
-
32
-
33
-
34
-
35
-
36
-
37
-
38
-
39
-
40
-
41
-
42
-
43
-
44
-
45
-
46
-
47
-
48
-
49
-
50
-
51
-
52
-
53
-
54
-
55
-
56
-
57
-
58
-
59
-
60
-
61
-
62
-
63
-
64
-
65
-
66
-
67
-
68
-
69
-
70
-
71
-
72
-
73
-
74
-
75
-
76
-
77
-
78
-
79
-
80
-
81
-
 82
82 -
 83
83 -
 84
84 -
 85
85 -
 86
86 -
 87
87 -
 88
88 -
 89
89 -
 90
90 -
 91
91 -
 92
92 -
 93
93 -
 94
94 -
 95
95 -
 96
96 -
 97
97 -
 98
98 -
 99
99 -
 100
100 -
 101
101
 |
 |

SYSCO CORPORATION-Form10-K 81
PARTII
ITEM8Financial Statements and Supplementary Data
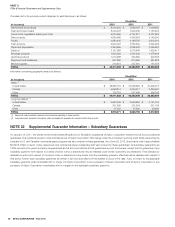
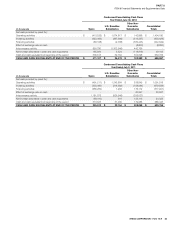
The following condensed consolidating nancial statements present separately the nancial position, comprehensive income and cash ows of the parent
issuer (Sysco Corporation), the guarantors (the majority of Sysco’s U.S. Broadline subsidiaries) and all other non-guarantor subsidiaries of Sysco (Other
Non-Guarantor Subsidiaries) on a combined basis with eliminating entries.
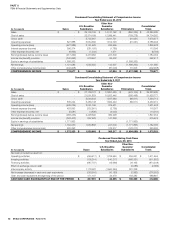
(Inthousands)
Condensed Consolidating Balance Sheet
June29,2013
Sysco U.S. Broadline
Subsidiaries
Other Non-
Guarantor
Subsidiaries Eliminations Consolidated
Totals
Current assets $ 276,713 $ 3,746,192 $ 2,184,522 $ - $ 6,207,427
Investment in subsidiaries 8,429,887 - - (8,429,887) -
Plant and equipment, net 540,860 1,885,908 1,551,303 - 3,978,071
Other assets 325,045 534,713 1,618,691 - 2,478,449
TOTAL ASSETS $ 9,572,505 $ 6,166,813 $ 5,354,516 $ (8,429,887) $ 12,663,947
Current liabilities $ 664,366 $ 928,824 $ 2,156,092 $ - $ 3,749,282
Intercompany payables (receivables) 594,928 (1,003,219) 408,291 - -
Long-term debt 2,606,612 10,422 22,952 - 2,639,986
Other liabilities 514,789 414,623 153,457 - 1,082,869
Shareholders’ equity 5,191,810 5,816,163 2,613,724 (8,429,887) 5,191,810
TOTAL LIABILITIES AND SHAREHOLDERS’ EQUITY $ 9,572,505 $ 6,166,813 $ 5,354,516 $ (8,429,887) $ 12,663,947
(Inthousands)
Condensed Consolidating Balance Sheet
June30,2012
Sysco U.S. Broadline
Subsidiaries
Other Non-
Guarantor
Subsidiaries Eliminations Consolidated
Totals
Current assets $ 538,451 $ 3,675,676 $ 1,870,681 $ - $ 6,084,808
Investment in subsidiaries 10,334,147 - - (10,334,147) -
Plant and equipment, net 703,658 1,923,925 1,256,167 - 3,883,750
Other assets 324,839 532,922 1,310,888 - 2,168,649
TOTAL ASSETS $ 11,901,095 $ 6,132,523 $ 4,437,736 $ (10,334,147) $ 12,137,207
Current liabilities $ 678,527 $ 900,416 $ 1,844,636 $ - $ 3,423,579
Intercompany payables (receivables) 3,068,001 (3,334,860) 266,859 - -
Long-term debt 2,714,415 25,459 23,814 - 2,763,688
Other liabilities 755,112 396,659 113,129 - 1,264,900
Shareholders’ equity 4,685,040 8,144,849 2,189,298 (10,334,147) 4,685,040
TOTAL LIABILITIES AND SHAREHOLDERS’ EQUITY $ 11,901,095 $ 6,132,523 $ 4,437,736 $ (10,334,147) $ 12,137,207
(Inthousands)
Condensed Consolidating Statement of Comprehensive Income
Year Ended June29,2013
Sysco U.S. Broadline
Subsidiaries
Other Non-
Guarantor
Subsidiaries Eliminations Consolidated
Totals
Sales $ - $ 30,162,329 $ 15,335,180 $ (1,086,276) $ 44,411,233
Cost of sales - 24,385,677 13,127,398 (969,433) 36,543,642
Gross pro t - 5,776,652 2,207,782 (116,843) 7,867,591
Operating expenses 694,323 3,610,907 2,020,726 (116,843) 6,209,113
Operating income (loss) (694,323) 2,165,745 187,056 - 1,658,478
Interest expense (income) 298,474 (177,421) 7,442 - 128,495
Other expense (income), net (12,864) (4,554) (54) - (17,472)
Earnings (losses) before income taxes (979,933) 2,347,720 179,668 - 1,547,455
Income tax (bene t) provision (351,474) 842,062 64,440 - 555,028
Equity in earnings of subsidiaries 1,620,886 - - (1,620,886) -
Net earnings 992,427 1,505,658 115,228 (1,620,886) 992,427
Other comprehensive income (loss) 215,929 - (33,191) 33,191 215,929
COMPREHENSIVE INCOME $ 1,208,356 $ 1,505,658 $ 82,037 $ (1,587,695) $ 1,208,356