Sysco 2013 Annual Report Download - page 2
Download and view the complete annual report
Please find page 2 of the 2013 Sysco annual report below. You can navigate through the pages in the report by either clicking on the pages listed below, or by using the keyword search tool below to find specific information within the annual report.-
 1
1 -
 2
2 -
 3
3 -
 4
4 -
 5
5 -
 6
6 -
 7
7 -
 8
8 -
 9
9 -
 10
10 -
 11
11 -
 12
12 -
 13
13 -
14
-
15
-
16
-
17
-
18
-
19
-
20
-
21
-
22
-
23
-
24
-
25
-
26
-
27
-
28
-
29
-
30
-
31
-
32
-
33
-
34
-
35
-
36
-
37
-
38
-
39
-
40
-
41
-
42
-
43
-
44
-
45
-
46
-
47
-
48
-
49
-
50
-
51
-
52
-
53
-
54
-
55
-
56
-
57
-
58
-
59
-
60
-
61
-
62
-
63
-
64
-
65
-
66
-
67
-
68
-
69
-
70
-
71
-
72
-
73
-
74
-
75
-
76
-
77
-
78
-
79
-
80
-
81
-
82
-
83
-
84
-
85
-
86
-
87
-
88
-
89
-
90
-
91
-
92
-
93
-
94
-
95
-
96
-
97
-
98
-
99
-
100
-
101
 |
 |

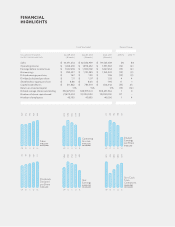
FINANCIAL
HIGHLIGHTS
Fiscal Year Ended Percent Change
DOLLARS IN THOUSANDS, June , June , July ,
EXCEPT FOR PER SHARE DATA ( weeks) ( weeks) ( weeks)
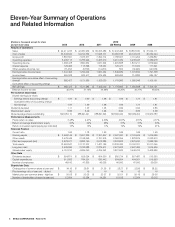
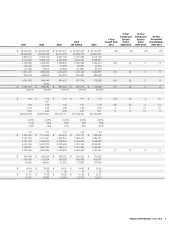
Sales ,, ,, ,,
Operating income ,, ,, ,,
Earnings before income taxes ,, ,, ,,
Net earnings , ,, ,,
Diluted earnings per share . . .
Dividends declared per share . . .
Shareholders’ equity per share . . .
Capital expenditures , , ,
Return on invested capital
Diluted average shares outstanding ,, ,, ,,
Number of shares repurchased ,, ,, ,,
Number of employees , , ,
09
36.9
10
37.2
11
39.3
12
42.4
13
44.4
Sales
IN BILLIONS
OF DOLLARS
09
.94
10
.99
11
1.03
12
1.07
13
1.11
Dividends
Declared
per Share
IN DOLLARS
09
1.77
10
1.99
11
1.96
12
1.90
13
1.67
Diluted
Earnings
per Share
IN DOLLARS
09
1,577
10
885
11
1,092
12
1,404
13
1,512
Net Cash
from
Operations
IN MILLIONS
OF DOLLARS
1,872
1,976
1,932
1,891
1,658
Operating
Income
IN MILLIONS
OF DOLLARS
1,056
1,180
1,152
1,122
992
Net
Earnings
IN MILLIONS
OF DOLLARS