Sysco 2013 Annual Report Download - page 87
Download and view the complete annual report
Please find page 87 of the 2013 Sysco annual report below. You can navigate through the pages in the report by either clicking on the pages listed below, or by using the keyword search tool below to find specific information within the annual report.-
 1
1 -
2
-
3
-
4
-
5
-
6
-
7
-
8
-
9
-
10
-
11
-
12
-
13
-
14
-
15
-
16
-
17
-
18
-
19
-
20
-
21
-
22
-
23
-
24
-
25
-
26
-
27
-
28
-
29
-
30
-
31
-
32
-
33
-
34
-
35
-
36
-
37
-
38
-
39
-
40
-
41
-
42
-
43
-
44
-
45
-
46
-
47
-
48
-
49
-
50
-
51
-
52
-
53
-
54
-
55
-
56
-
57
-
58
-
59
-
60
-
61
-
62
-
63
-
64
-
65
-
66
-
67
-
68
-
69
-
70
-
71
-
72
-
73
-
74
-
75
-
76
-
 77
77 -
 78
78 -
 79
79 -
 80
80 -
 81
81 -
 82
82 -
 83
83 -
 84
84 -
 85
85 -
 86
86 -
 87
87 -
 88
88 -
 89
89 -
 90
90 -
 91
91 -
 92
92 -
 93
93 -
 94
94 -
 95
95 -
 96
96 -
 97
97 -
98
-
99
-
100
-
101
 |
 |

SYSCO CORPORATION-Form10-K76
PARTII
ITEM8Financial Statements and Supplementary Data
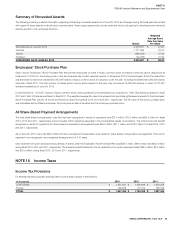
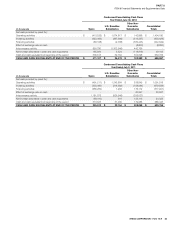
The income tax provision for each scal year consists of the following:
(Inthousands)
2013 2012 2011
UnitedStates federal income taxes $ 439,667 $ 540,861 $ 556,663
State and local income taxes 69,759 77,064 60,081
Foreign income taxes 45,602 44,492 58,680
TOTAL $ 555,028 $ 662,417 $ 675,424
The current and deferred components of the income tax provisions for each scal year are as follows:
(Inthousands)
2013 2012 2011
Current $ 582,889 $ 840,745 $ 840,173
Deferred (27,861) (178,328) (164,749)
TOTAL $ 555,028 $ 662,417 $ 675,424
The deferred tax provisions result from the effects of net changes during the year in deferred tax assets and liabilities arising from temporary differences
between the carrying amounts of assets and liabilities for nancial reporting purposes and the amounts used for income tax purposes.
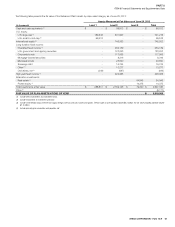
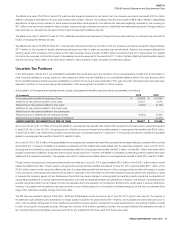
Deferred Tax Assets and Liabilities
Signi cant components of Sysco’s deferred tax assets and liabilities are as follows:
(Inthousands)
June29,2013 June30,2012
Deferred tax liabilities:
Excess tax depreciation and basis differences of assets $ 455,752 $ 473,947
Goodwill and intangible assets 208,229 186,921
Other 18,127 19,756
Total deferred tax liabilities 682,108 680,624
Deferred tax assets:
Net operating tax loss carryforwards 19,149 21,609
Bene t on unrecognized tax bene ts 23,833 23,287
Pension 224,990 362,391
Share-based compensation 39,316 63,522
Deferred compensation 34,951 36,639
Self-insured liabilities 47,538 41,030
Receivables 48,236 51,607
Inventory 63,509 59,619
Other 50,575 40,257
Total deferred tax assets 552,097 699,961
TOTAL NET DEFERRED TAX LIABILITIES (ASSETS) $ 130,011 $ (19,337)
The company had state net operating tax loss carryforwards as of June29,2013 and June30,2012. The net operating tax loss carryforwards outstanding
as of June29,2013 expire in scal years 2014 through 2033. There were no valuation allowances recorded for the state tax loss carryforwards as of
June29,2013 and June30,2012 because management believes it is more likely than not that these bene ts will be realized based on utilization forecasts.
Sysco’s deferred taxes were impacted by an IRS settlement related to Sysco’s af liate, Baugh Supply Chain Cooperative, which resulted in payments of
deferred taxes of $212.0million in each of scal 2012,2011, and 2010. Sysco reclassi ed amounts due within one year from deferred taxes to accrued
income taxes at the beginning of each of scal 2012,2011, and 2010.
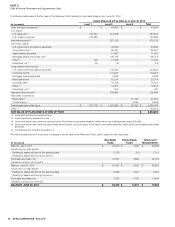
Effective Tax Rates
Reconciliations of the statutory federal income tax rate to the effective income tax rates for each scal year are as follows:
2013 2012 2011
UnitedStates statutory federal income tax rate 35.00% 35.00% 35.00%
State and local income taxes, net of any applicable federal income tax bene t 2.59 2.65 1.96
Foreign income taxes (1.22) (1.07) (0.50)
Impact of uncertain tax bene ts 0.37 0.12 0.51
Impact of adjusting carrying value of corporate-owned life insurance policies to their cash surrender
values (0.13) (0.08) (0.61)
Other (0.74) 0.51 0.60
35.87% 37.13% 36.96%