Sysco 2013 Annual Report Download - page 35
Download and view the complete annual report
Please find page 35 of the 2013 Sysco annual report below. You can navigate through the pages in the report by either clicking on the pages listed below, or by using the keyword search tool below to find specific information within the annual report.-
 1
1 -
2
-
3
-
4
-
5
-
6
-
7
-
8
-
9
-
10
-
11
-
12
-
13
-
14
-
15
-
16
-
17
-
18
-
19
-
20
-
21
-
22
-
23
-
24
-
 25
25 -
 26
26 -
 27
27 -
 28
28 -
 29
29 -
 30
30 -
 31
31 -
 32
32 -
 33
33 -
 34
34 -
 35
35 -
 36
36 -
 37
37 -
 38
38 -
 39
39 -
 40
40 -
 41
41 -
 42
42 -
 43
43 -
 44
44 -
 45
45 -
46
-
47
-
48
-
49
-
50
-
51
-
52
-
53
-
54
-
55
-
56
-
57
-
58
-
59
-
60
-
61
-
62
-
63
-
64
-
65
-
66
-
67
-
68
-
69
-
70
-
71
-
72
-
73
-
74
-
75
-
76
-
77
-
78
-
79
-
80
-
81
-
82
-
83
-
84
-
85
-
86
-
87
-
88
-
89
-
90
-
91
-
92
-
93
-
94
-
95
-
96
-
97
-
98
-
99
-
100
-
101
 |
 |
SYSCO CORPORATION-Form10-K24
PARTII
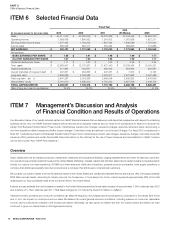
ITEM7Management’s Discussion and Analysis ofFinancial Condition and Results of Operations
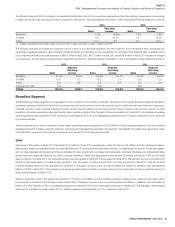
The effective tax rate of 35.87% for scal 2013 was favorably impacted primarily by two items. First, we recorded a tax bene t of $14.0million related to
changes in estimates for the prior year domestic tax provision. Second, we recorded a tax bene t of $8.8million related to disqualifying dispositions of
Sysco stock pursuant to share-based compensation arrangements. The effective tax rate was negatively impacted by the recording of $5.7million in tax
and interest related to various federal, foreign and state uncertain tax positions. Inde nitely reinvested earnings taxed at foreign statutory rates less than
our domestic tax rate also had the impact of reducing the effective tax rate.
The effective tax rate for scal 2012was 37.13%. Inde nitely reinvested earnings taxed at foreign statutory tax rates less than our domestic tax rate had
the impact of reducing the effective tax rate.
The effective tax rate of 36.96% for scal 2011 was favorably impacted primarily by two items. First, we recorded a tax bene t of approximately $17.0million
for the reversal of valuation allowances previously recorded on state net operating loss carryforwards. Second, we adjust the carrying values of our COLI
policies to their cash surrender values. The gain of $28.2million recorded in scal 2011 was primarily non-taxable for income tax purposes, and had the
impact of decreasing income tax expense for the period by $11.1million. Partially offsetting these favorable impacts was the recording of $9.3million in
tax and interest related to various federal, foreign and state uncertain tax positions.
Earnings Per Share
Basic earnings per share in scal 2013 was $1.68, a 12.0% decrease from the comparable prior year period amount of $1.91 per share. Diluted earnings
per share in scal 2013 was $1.67, a 12.1% decrease from the comparable prior year period amount of $1.90 per share. This decrease was primarily the
result of the factors discussed above. Adjusted diluted earnings per share in scal 2013 was $2.14, a decrease of 0.5% from the comparable prior year
period amount of $2.15.
All earnings per share metrics for the scal 2013 were partially impacted from greatershares outstanding. Sysco experienced a greater number of stock
option exercises in scal 2013 as compared to scal 2012, which has increased the number ofshares outstanding.
Basic and diluted earnings per share in scal 2012 were $1.91 and $1.90, respectively. This represents a 2.6% decrease from the comparable prior year
period amount for basic earnings per share of $1.96 per share and a 3.1% decrease from the comparable prior year period amount for diluted earnings
per share of $1.96. This decrease was primarily the result of the factors discussed above. Adjusted diluted earnings per share was $2.14 in scal 2012
and $2.05 in scal 2011, or an increase of 4.4%.
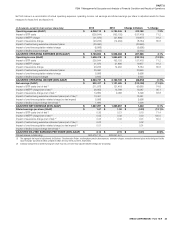
Non-GAAP Reconciliations
Sysco’s results of operations are impacted by costs from the Business Transformation Project (BTP costs), multiemployer pension plans (MEPP), severance,
executive retirement plans restructuring, a one-time acquisition related charge and facility closure charges. Management believes that adjusting its operating
expenses, operating income, net earnings and diluted earnings per share to remove the impact of these items provides an important perspective with
respect to underlying business trends and results and provides meaningful supplemental information to both management and investors that is indicative
of the performance of the company’s underlying operations and facilitates comparison on a year-over year basis.
Additionally, near the end of scal 2011, we reallocated all of our investments in our COLI policies into low-risk, xed-income securities and therefore we
do not expect signi cant volatility in operating expenses, operating income, net earnings and diluted earnings per share in future periods related to these
policies. We experienced signi cant gains in these policies during scal 2011. In addition, we recorded tax bene ts in scal 2011. As such, the comparison
of scal 2012 and scal 2011 is also adjusted for COLI gains and recognized tax bene ts.
The company uses these non-GAAP measures when evaluating its nancial results as well as for internal planning and forecasting purposes. These nancial
measures should not be used as a substitute in assessing the company’s results of operations for periods presented. An analysis of any non-GAAP nancial
measure should be used in conjunction with results presented in accordance with GAAP. As a result, in the tables below, where applicable, each period
presented is adjusted to remove costs of the Business Transformation Project, MEPP, severance, executive retirement plan restructuring, a one-time
acquisition related charge, facility closure charges, COLI gains and recognized tax bene ts.