Sysco 2013 Annual Report Download - page 33
Download and view the complete annual report
Please find page 33 of the 2013 Sysco annual report below. You can navigate through the pages in the report by either clicking on the pages listed below, or by using the keyword search tool below to find specific information within the annual report.-
 1
1 -
2
-
3
-
4
-
5
-
6
-
7
-
8
-
9
-
10
-
11
-
12
-
13
-
14
-
15
-
16
-
17
-
18
-
19
-
20
-
21
-
22
-
 23
23 -
 24
24 -
 25
25 -
 26
26 -
 27
27 -
 28
28 -
 29
29 -
 30
30 -
 31
31 -
 32
32 -
 33
33 -
 34
34 -
 35
35 -
 36
36 -
 37
37 -
 38
38 -
 39
39 -
 40
40 -
 41
41 -
 42
42 -
 43
43 -
44
-
45
-
46
-
47
-
48
-
49
-
50
-
51
-
52
-
53
-
54
-
55
-
56
-
57
-
58
-
59
-
60
-
61
-
62
-
63
-
64
-
65
-
66
-
67
-
68
-
69
-
70
-
71
-
72
-
73
-
74
-
75
-
76
-
77
-
78
-
79
-
80
-
81
-
82
-
83
-
84
-
85
-
86
-
87
-
88
-
89
-
90
-
91
-
92
-
93
-
94
-
95
-
96
-
97
-
98
-
99
-
100
-
101
 |
 |

SYSCO CORPORATION-Form10-K22
PARTII
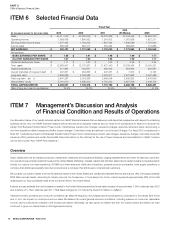
ITEM7Management’s Discussion and Analysis ofFinancial Condition and Results of Operations
Anon-quali ed de ned contribution plan became effective on January1,2013 as a replacement plan and bene ts were frozen under the SERP at the
end of scal 2013. We believe this restructuring more closely aligned our executive plans with our non-executive plans. As a result of this restructuring, we
incurred $21.0million in charges in scal 2013. We expect our retirement-related expenses in scal 2014 as compared to scal 2013 will decrease in the
range of $75million to $85million primarily from reduced expenses of our Retirement Plan, partially offset by increased de ned contribution plan expenses.
A greater portion of the decrease will occur in the second half of scal 2014 due to operation of our enhanced, de ned contribution plan for a one-year
period. Excluding the $21.0million restructuring charge in scal 2013 and the decrease in scal 2014 is expected to be $50million to $60million. Over
the long-term, we believe the changes to all of these retirement programs will result in reduced volatility of retirement-related expenses and a reduction in
total retirement-related expenses.
Depreciation and amortization expense increased by $95.6million in scal 2013 over scal 2012. The increase related to our Business Transformation
Project is described above. The remaining increase of $36.0million in scal 2013 was primarily related to assets that were not placed in service in scal
2012 that were in service in scal 2013, primarily from new facilities, property from new acquisitions and expansions.
From time to time, we may voluntarily withdraw from multiemployer pension plans to minimize or limit our future exposure to these plans. In scal 2013 and
scal 2012, we recorded provisions of $41.9million and $21.9million, respectively, related to multiemployer pension plan withdrawals.
Fuel costs increased by $18.9million in scal 2013 over scal 2012. The increase was primarily due to increased contracted diesel prices and increased
gallon usage. Our costs per gallon increased 2.8% in scal 2013 over scal 2012. Our activities to mitigate fuel costs include reducing miles driven by
our trucks through improved routing techniques, improving eet utilization by adjusting idling time and maximum speeds and using fuel surcharges. We
routinely enter into forward purchase commitments for a portion of our projected monthly diesel fuel requirements with a goal of mitigating a portion of
the volatility in fuel prices.
Our fuel commitments will result in either additional fuel costs or avoided fuel costs based on the comparison of the prices on the xed price contracts
and market prices for the respective periods. In scal 2013, the forward purchase commitments resulted in an estimated $17.8million of avoided fuel
costs as the xed price contracts were generally lower than market prices for the contracted volumes. In scal 2012, the forward purchase commitments
resulted in an estimated $20.2million of avoided fuel costs as the xed price contracts were generally lower than market prices for the contracted volumes.
As of June29,2013, we had forward diesel fuel commitments totaling approximately $204.0million through August2014. These contracts will lock in the
price of approximately 60% to 65% of our fuel purchase needs for the remainder of the scal year at prices slightly lower than the current market price
for diesel. Assuming that fuel prices do not rise signi cantly over recent levels during scal 2014, fuel costs, exclusive of any amounts recovered through
fuel surcharges, are expected to increase by approximately $10 to $20million as compared to scal 2013. Our estimate is based upon current, published
quarterly market price projections for diesel, the cost committed to in our forward fuel purchase agreements currently in place for scal 2014 and estimates
of fuel consumption. Actual fuel costs could vary from our estimates if any of these assumptions change, in particular if future fuel prices vary signi cantly
from our current estimates. We continue to evaluate all opportunities to offset potential increases in fuel expense, including the use of fuel surcharges and
overall expense management.
We also measure our expense performance on a cost per case basis. This metric is calculated by taking the total operating expense of our Broadline
companies, excluding charges multiemployer pension plans and severance charges, divided by the number of cases sold. We seek to grow our sales and
either minimize or reduce our costs on a per case basis. Our scal 2013 cost per case decreased by more than $0.03 per case as compared to scal
2012 primarily from reduced pay-related expenses from our sales and information technology areas, partially offset by increased costs from delivery and
warehouse pay-related expenses, increased retirement-related expenses and fuel increases. We expect to continue to reduce our Broadline companies
cost per case in scal 2014 by approximately $0.05 per case partially from reduced retirement-related expenses.
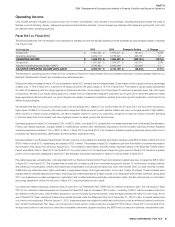
Fiscal 2012 vs. Fiscal 2011
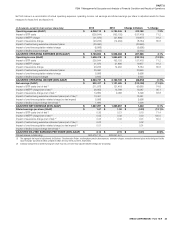
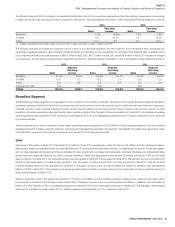
The following table sets forth the change in the components of operating income and adjusted operating income expressed as a percentage increase or decrease
over the prior year:
(Inthousands)
2012 2011 Change in Dollars % Change
Gross pro t $ 7,676,577 $ 7,394,712 $ 281,865 3.8%
Operating expenses 5,785,945 5,463,210 322,735 5.9
OPERATING INCOME $ 1,890,632 $ 1,931,502 $ (40,870) (2.1)%
Gross pro t $ 7,676,577 $ 7,394,712 $ 281,865 3.8%
Adjusted operating expenses (Non-GAAP) 5,560,189 5,338,506 221,683 4.2
ADJUSTED OPERATING INCOME (NON-GAAP) $ 2,116,388 $ 2,056,206 $ 60,182 2.9%
Thedecreasein operating income from scal 2012 to scal 2011 was primarily driven by declines in gross margin and increased operating expenses
partially from increased expenses from payroll and our Business Transformation Project. These expense increases were partially offset by increases in
gross pro t dollars.