Sysco 2013 Annual Report Download - page 95
Download and view the complete annual report
Please find page 95 of the 2013 Sysco annual report below. You can navigate through the pages in the report by either clicking on the pages listed below, or by using the keyword search tool below to find specific information within the annual report.-
 1
1 -
2
-
3
-
4
-
5
-
6
-
7
-
8
-
9
-
10
-
11
-
12
-
13
-
14
-
15
-
16
-
17
-
18
-
19
-
20
-
21
-
22
-
23
-
24
-
25
-
26
-
27
-
28
-
29
-
30
-
31
-
32
-
33
-
34
-
35
-
36
-
37
-
38
-
39
-
40
-
41
-
42
-
43
-
44
-
45
-
46
-
47
-
48
-
49
-
50
-
51
-
52
-
53
-
54
-
55
-
56
-
57
-
58
-
59
-
60
-
61
-
62
-
63
-
64
-
65
-
66
-
67
-
68
-
69
-
70
-
71
-
72
-
73
-
74
-
75
-
76
-
77
-
78
-
79
-
80
-
81
-
82
-
83
-
84
-
 85
85 -
 86
86 -
 87
87 -
 88
88 -
 89
89 -
 90
90 -
 91
91 -
 92
92 -
 93
93 -
 94
94 -
 95
95 -
 96
96 -
 97
97 -
 98
98 -
 99
99 -
 100
100 -
 101
101
 |
 |

SYSCO CORPORATION-Form10-K84
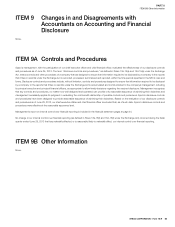
PARTII
ITEM8Financial Statements and Supplementary Data
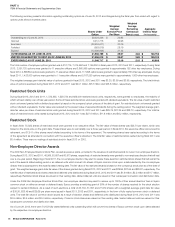
NOTE23 Quarterly Results (Unaudited)
Financial information for each quarter in the years ended June29,2013 and June30,2012 is set forth below:
(Inthousands except for per share data)
Fiscal 2013 Quarter Ended
Fiscal YearSeptember29 December29 March30 June29
Sales $ 11,086,916 $ 10,796,890 $ 10,926,371 $ 11,601,056 $ 44,411,233
Cost of sales 9,083,372 8,879,324 9,016,052 9,564,894 36,543,642
Gross pro t 2,003,544 1,917,566 1,910,319 2,036,162 7,867,591
Operating expenses 1,524,762 1,534,915 1,573,117 1,576,319 6,209,113
Operating income 478,782 382,651 337,202 459,843 1,658,478
Interest expense 30,868 32,242 34,215 31,170 128,495
Other expense (income), net (2,477) (1,753) (3,410) (9,832) (17,472)
Earnings before income taxes 450,391 352,162 306,397 438,505 1,547,455
Income taxes 163,793 130,793 104,980 155,462 555,028
NET EARNINGS $ 286,598 $ 221,369 $ 201,417 $ 283,043 $ 992,427
Per share:
BASIC NET EARNINGS $ 0.49 $ 0.38 $ 0.34 $ 0.48 $ 1.68
DILUTED NET EARNINGS 0.49 0.38 0.34 0.47 1.67
Dividends declared 0.27 0.28 0.28 0.28 1.11
Market price— high/low 31-28 32-30 36-31 35-33 36-28
(Inthousands except for per share data)
Fiscal 2012 Quarter Ended
Fiscal YearOctober1 December31 March31 June30
Sales $ 10,586,390 $ 10,244,421 $ 10,504,746 $ 11,045,382 $ 42,380,939
Cost of sales 8,638,790 8,398,771 8,633,130 9,033,671 34,704,362
Gross pro t 1,947,600 1,845,650 1,871,616 2,011,711 7,676,577
Operating expenses 1,438,260 1,418,652 1,432,786 1,496,247 5,785,945
Operating income 509,340 426,998 438,830 515,464 1,890,632
Interest expense 29,474 28,324 28,290 27,308 113,396
Other (income), net 250 (3,472) (2,248) (1,296) (6,766)
Earnings before income taxes 479,616 402,146 412,788 489,452 1,784,002
Income taxes 176,963 152,033 153,238 180,183 662,417
NET EARNINGS $ 302,653 $ 250,113 $ 259,550 $ 309,269 $ 1,121,585
Per share:
BASIC NET EARNINGS $ 0.51 $ 0.43 $ 0.44 $ 0.53 $ 1.91
DILUTED NET EARNINGS 0.51 0.43 0.44 0.53 1.90
Dividends declared 0.26 0.27 0.27 0.27 1.07
Market price— high/low 32-25 30-25 31-29 30-27 32-25
PERCENTAGE CHANGE— 2013 VS. 2012:
Quarter 1 Quarter 2 Quarter 3 Quarter 4 Fiscal Year
Sales 5% 5% 4% 5% 5%
Operating income (6) (10) (23) (11) (12)
Net earnings (5) (11) (22) (8) (12)
Basic net earnings per share (4) (12) (23) (9) (12)
Diluted net earnings per share (4) (12) (23) (11) (12)
Financial results are impacted by accounting changes and the adoption of various accounting standards. See Note2, “Changes in Accounting.”