Sysco 2013 Annual Report Download - page 44
Download and view the complete annual report
Please find page 44 of the 2013 Sysco annual report below. You can navigate through the pages in the report by either clicking on the pages listed below, or by using the keyword search tool below to find specific information within the annual report.-
 1
1 -
2
-
3
-
4
-
5
-
6
-
7
-
8
-
9
-
10
-
11
-
12
-
13
-
14
-
15
-
16
-
17
-
18
-
19
-
20
-
21
-
22
-
23
-
24
-
25
-
26
-
27
-
28
-
29
-
30
-
31
-
32
-
33
-
 34
34 -
 35
35 -
 36
36 -
 37
37 -
 38
38 -
 39
39 -
 40
40 -
 41
41 -
 42
42 -
 43
43 -
 44
44 -
 45
45 -
 46
46 -
 47
47 -
 48
48 -
 49
49 -
 50
50 -
 51
51 -
 52
52 -
 53
53 -
 54
54 -
55
-
56
-
57
-
58
-
59
-
60
-
61
-
62
-
63
-
64
-
65
-
66
-
67
-
68
-
69
-
70
-
71
-
72
-
73
-
74
-
75
-
76
-
77
-
78
-
79
-
80
-
81
-
82
-
83
-
84
-
85
-
86
-
87
-
88
-
89
-
90
-
91
-
92
-
93
-
94
-
95
-
96
-
97
-
98
-
99
-
100
-
101
 |
 |
SYSCO CORPORATION-Form10-K 33
PARTII
ITEM7Management’s Discussion and Analysis ofFinancial Condition and Results of Operations
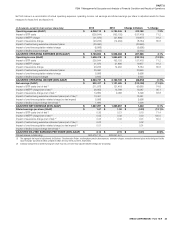
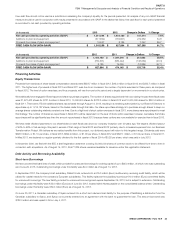
Free cash ow should not be used as a substitute in assessing the company’s liquidity for the periods presented. An analysis of any non-GAAP nancial
measure should be used in conjunction with results presented in accordance with GAAP. In the tables that follow, free cash ow for each period presented
is reconciled to net cash provided by operating activities.
(Inthousands)
2013 2012 Change in Dollars % Change
Net cash provided by operating activities (GAAP) $ 1,511,594 $ 1,404,180 $ 107,414 7.6%
Additions to plant and equipment (511,862) (784,501) 272,639 34.8
Proceeds from sales of plant and equipment 15,527 8,185 7,342 89.7
FREE CASH FLOW (NON-GAAP) $ 1,015,259 $ 627,864 $ 387,395 61.7%
(Inthousands)
2012 2011 Change in Dollars % Change
Net cash provided by operating activities (GAAP) $ 1,404,180 $ 1,091,518 $ 312,662 28.6%
Additions to plant and equipment (784,501) (636,442) (148,059) (23.3)
Proceeds from sales of plant and equipment 8,185 19,069 (10,884) (57.1)
FREE CASH FLOW (NON-GAAP) $ 627,864 $ 474,145 $ 153,719 32.4%
Financing Activities
Equity Transactions
Proceeds from exercises of share-based compensation awards were $628.7million in scal 2013, $99.4million in scal 2012 and $332.7million in scal
2011. The higher level of proceeds in scal 2013 and scal 2011 was due to an increase in the number of options exercised in these years, as compared
to scal 2012. The level of option exercises, and thus proceeds, will vary from period to period and is largely dependent on movements in our stock price.
We traditionally have engaged in Board-approved share repurchase programs. The number ofshares acquired and their cost during the past three scal years
were 21,672,403shares for $721.6million in scal 2013, 10,000,000shares for $272.3million in scal 2012 and 10,000,000shares for $291.6million in
scal 2011. There were 275,000 additionalshares repurchased through August14,2013, resulting in a remaining authorization by our Board of Directors to
repurchase up to 1,214,197shares, based on the trades made through that date. Our share repurchase strategy is to purchase enoughshares to keep our
averageshares outstanding relatively constant over time. Due to a high level of stock option exercises in scal 2013, moreshares were repurchased to meet
this strategy. The number ofshares we repurchase in scal 2014 will be dependent on the level of stock option exercises; however, we believe that share
repurchases will be signi cantly less than the amount repurchased in scal 2013 because fewer options are now available for exercise than in scal 2013.
We have made dividend payments to our shareholders in each scal year since our company inception over 40 years ago. We target a dividend payout
of 40% to 50% of net earnings. We paid in excess of that range in scal 2013 and scal 2012 primarily due to increased expenses from our Business
Transformation Project. We believe as we realize bene ts from this project, our dividend payout will return to this targeted range. Dividends paid were
$648.3million, or $1.10 per share, in scal 2013, $622.9million, or $1.06 per share, in scal 2012 and $597.1million, or $1.02 per share, in scal 2011.
In May2013, we declared our regular quarterly dividend for the rst quarter of scal 2014 of $0.28 per share, which was paid in July2013.
In November2000, we led with the SEC a shelf registration statement covering 30,000,000shares of common stock to be offered from time to time in
connection with acquisitions. As of August14,2013, 29,477,835shares remained available for issuance under this registration statement.
Debt Activity and Borrowing Availability
Short-term Borrowings
We have uncommitted bank lines of credit, which provided for unsecured borrowings for working capital of up to $95.0million, of which none was outstanding
as of June29,2013. Outstanding borrowings under this facility were $4.0million as of August14,2013.
In September2012, the company’s Irish subsidiary, Pallas Foods, entered into a €75.0million (Euro) multicurrency revolving credit facility, which will be
utilized for capital needs for the company’s European subsidiaries. This facility replaces the subsidiary’s previous €10.0million (Euro) committed facility
for unsecured borrowings. The new facility provides for unsecured borrowings and expires September25,2013, but is subject to extension. Outstanding
borrowings under this facility were €32.0million (Euro) as of June29,2013, located within Notes payable on the consolidated balance sheet. Outstanding
borrowings under this facility were €32.0million (Euro) as of August14,2013.
On June30,2011, a Canadian subsidiary of Sysco entered into a short-term demand loan facility for the purpose of facilitating a distribution from the
Canadian subsidiary to Sysco, and Sysco concurrently entered into an agreement with the bank to guarantee the loan. The amount borrowed was
$182.0million and was repaid in full on July4,2011.