Sysco 2013 Annual Report Download - page 8
Download and view the complete annual report
Please find page 8 of the 2013 Sysco annual report below. You can navigate through the pages in the report by either clicking on the pages listed below, or by using the keyword search tool below to find specific information within the annual report.-
 1
1 -
 2
2 -
 3
3 -
 4
4 -
 5
5 -
 6
6 -
 7
7 -
 8
8 -
 9
9 -
 10
10 -
 11
11 -
 12
12 -
 13
13 -
 14
14 -
 15
15 -
 16
16 -
 17
17 -
 18
18 -
 19
19 -
20
-
21
-
22
-
23
-
24
-
25
-
26
-
27
-
28
-
29
-
30
-
31
-
32
-
33
-
34
-
35
-
36
-
37
-
38
-
39
-
40
-
41
-
42
-
43
-
44
-
45
-
46
-
47
-
48
-
49
-
50
-
51
-
52
-
53
-
54
-
55
-
56
-
57
-
58
-
59
-
60
-
61
-
62
-
63
-
64
-
65
-
66
-
67
-
68
-
69
-
70
-
71
-
72
-
73
-
74
-
75
-
76
-
77
-
78
-
79
-
80
-
81
-
82
-
83
-
84
-
85
-
86
-
87
-
88
-
89
-
90
-
91
-
92
-
93
-
94
-
95
-
96
-
97
-
98
-
99
-
100
-
101
 |
 |
SYSCO CORPORATION-Form10-K6
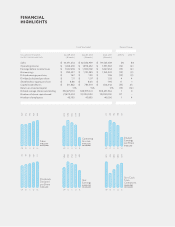
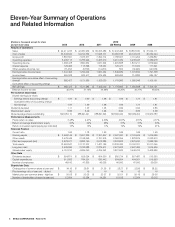
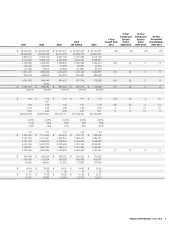
Eleven-Year Summary of Operations
and Related Information
(Dollars in thousands except for share
andpershare data)
2013 2012 2011 2010
(53 Weeks) 2009 2008
Results of Operations
Sales $ 44,411,233 $ 42,380,939 $ 39,323,489 $ 37,243,495 $ 36,853,330 $ 37,522,111
Cost of sales 36,543,642 34,704,362 31,928,777 30,055,188 29,743,076 30,252,244
Gross pro t 7,867,591 7,676,577 7,394,712 7,188,307 7,110,254 7,269,867
Operating expenses 6,209,113 5,785,945 5,463,210 5,212,439 5,238,043 5,389,918
Operating income 1,658,478 1,890,632 1,931,502 1,975,868 1,872,211 1,879,949
Interest expense 128,495 113,396 118,267 125,477 116,322 111,541
Other expense (income), net (17,472) (6,766) (14,219) 802 (14,945) (22,930)
Earnings before income taxes 1,547,455 1,784,002 1,827,454 1,849,589 1,770,834 1,791,338
Income taxes 555,028 662,417 675,424 669,606 714,886 685,187
Earnings before cumulative effect of accounting
change 992,427 1,121,585 1,152,030 1,179,983 1,055,948 1,106,151
Cumulative effect of accounting change - - - - - -
Net earnings $ 992,427 $ 1,121,585 $ 1,152,030 $ 1,179,983 $ 1,055,948 $ 1,106,151
Effective income tax rate 35.87% 37.13% 36.96% 36.20% 40.37% 38.25%
Per Common Share Data
Diluted earnings per share:
Earnings before accounting change $ 1.67 $ 1.90 $ 1.96 $ 1.99 $ 1.77 $ 1.81
Cumulative effect of accounting change - - - - - -
Net earnings 1.67 1.90 1.96 1.99 1.77 1.81
Dividends declared 1.11 1.07 1.03 0.99 0.94 0.85
Shareholders’ equity 8.86 8.00 7.95 6.50 5.85 5.68
Diluted average shares outstanding 592,675,110 588,991,441 588,691,546 593,590,042 596,069,204 610,970,783
Performance Measurements
Pretax return on sales 3.48% 4.21% 4.65% 4.97% 4.81% 4.77%
Return on average shareholders’ equity 20% 24% 28% 31% 31% 33%
Return on invested capital (equity plus total debt) 13% 15% 17% 19% 19% 21%
Financial Position
Current ratio 1.66 1.78 1.60 1.69 1.69 1.49
Working capital $ 2,458,145 $ 2,661,229 $ 2,157,807 $ 2,067,060 $ 2,120,525 $ 1,675,690
Other assets 2,478,449 2,168,649 2,181,919 2,056,355 1,978,875 2,023,910
Plant and equipment (net) 3,978,071 3,883,750 3,512,389 3,203,823 2,979,200 2,889,790
Total assets 12,663,947 12,137,207 11,427,190 10,336,436 10,160,321 10,017,055
Long-term debt 2,639,986 2,763,688 2,279,517 2,472,662 2,467,486 1,975,435
Shareholders’ equity 5,191,810 4,685,040 4,705,242 3,827,526 3,449,702 3,408,986
Other Data
Dividends declared $ 654,871 $ 628,024 $ 604,500 $ 585,734 $ 557,487 $ 513,593
Capital expenditures 511,862 784,501 636,442 594,604 464,561 515,963
Number of employees 48,100 47,800 46,000 46,000 47,000 50,000
Shareholder Data
Closing price of common share at year end $ 34.16 $ 29.81 $ 31.39 $ 28.27 $ 22.98 $ 28.22
Price/earnings ratio at year end - diluted 20 16 16 14 13 16
Market price per common share - high/low $ 36-28 $ 32-25 $ 33-27 $ 32-21 $ 35-19 $ 36-26
Number of shareholders of record at year end 12,604 13,594 14,291 15,158 12,564 13,015