Sysco 2013 Annual Report Download - page 28
Download and view the complete annual report
Please find page 28 of the 2013 Sysco annual report below. You can navigate through the pages in the report by either clicking on the pages listed below, or by using the keyword search tool below to find specific information within the annual report.-
 1
1 -
2
-
3
-
4
-
5
-
6
-
7
-
8
-
9
-
10
-
11
-
12
-
13
-
14
-
15
-
16
-
17
-
 18
18 -
 19
19 -
 20
20 -
 21
21 -
 22
22 -
 23
23 -
 24
24 -
 25
25 -
 26
26 -
 27
27 -
 28
28 -
 29
29 -
 30
30 -
 31
31 -
 32
32 -
 33
33 -
 34
34 -
 35
35 -
 36
36 -
 37
37 -
 38
38 -
39
-
40
-
41
-
42
-
43
-
44
-
45
-
46
-
47
-
48
-
49
-
50
-
51
-
52
-
53
-
54
-
55
-
56
-
57
-
58
-
59
-
60
-
61
-
62
-
63
-
64
-
65
-
66
-
67
-
68
-
69
-
70
-
71
-
72
-
73
-
74
-
75
-
76
-
77
-
78
-
79
-
80
-
81
-
82
-
83
-
84
-
85
-
86
-
87
-
88
-
89
-
90
-
91
-
92
-
93
-
94
-
95
-
96
-
97
-
98
-
99
-
100
-
101
 |
 |

SYSCO CORPORATION-Form10-K 17
PARTII
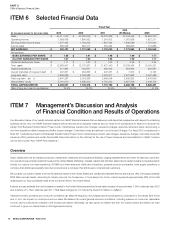
ITEM7Management’s Discussion and Analysis ofFinancial Condition and Results of Operations
Highlights
Fiscal 2013 was a year in which we progressed with our Business Transformation Project while facing a challenging business and economic environment.
The foodservice industry has not fully participated in the overall economic recovery primarily due to constrained consumer spending for food-away-from-
home. Our results of operations re ect these challenges as well as expenses related to our Business Transformation Project, payroll costs, charges from
the withdrawal from multiemployer pension plans and increased fuel expense. We believe our sales growth and expense management on a cost per cases
basis was acceptable, however gross pro t did not grow as we planned due partially to competitive pressures and a shift in customer mix. We will remain
focused on the execution of our business plan and initiatives from our Business Transformation Project, with the goal for these items to contribute to the
long-term success of our customers and in turn, growth in our earnings. We acquired 14 companies during scal 2013, which represents annualized sales
in excess of $1billion. We expect these acquisitions will contribute to our sales growth, enhance our international market presence and product assortment.
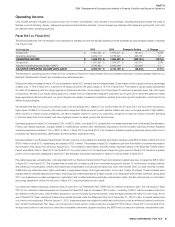
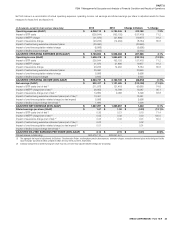
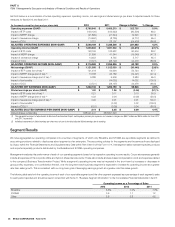
Comparison of results from scal 2013 to scal 2012:
•Sales increased 4.8%, or $2.0billion to $44.4billion.
•Operating income decreased12.3%, or $232.2million, to $1.7billion.
•Adjusted operating income decreased 1.7%, or $36.4million, to $2.1billion.
•Net earnings decreased11.5%, or $129.2million, to $1.0billion.
•Adjusted net earnings increased 0.1%, or $1.4million, to $1.3billion.
•
Basic earnings per share in scal 2013 was $1.68, a 12.0%decrease from the comparable prior year period amount of $1.91 per share. Diluted earnings
per share in scal 2013 was $1.67, a 12.1% decrease from the comparable prior year period amount of $1.90 per share.
•Adjusted diluted earnings per share was $2.14 in scal 2013, a 0.5% decrease from the comparable prior year amount of $2.15 per share.
See “Non-GAAP Reconciliations” for an explanation of these non-GAAP nancial measures.
Trends and Strategy
Trends
General economic conditions and consumer con dence can affect the frequency of purchases and amounts spent by consumers for food-away-from-home
and, in turn, can impact our customers and our sales. Consumer con dence has improved since 2008, however it remains below its historical highs. We
believe that the consumer is currently concerned about lingering unemployment levels and lack of growth in personal income. We believe these items and
other current general economic conditions, have negatively impacted consumer con dence and contributed to a slow rate of recovery in the foodservice
market. While these trends can be cyclical in nature, greater consumer con dence will be required to reverse the trend. According to industry sources, real
sales growth for the total foodservice market in the UnitedStates is expected to be modest over the long-term. Non-traditional competitors are becoming
more of a factor in terms of competition within our industry, and consumer spending trends are gradually shifting more to fresh, natural and sustainably-
produced products. We believe these industry trends reinforce the need for us to transform our business so that we can be in a position to provide greater
value to our customers and reduce our overall cost structure.
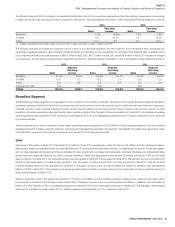
Our gross margin performance has been in uenced by multiple factors. Our sales growth in scal 2013 was greater with our large regional and national
customers. Gross margin from these types of customers is generally lower than our independent restaurant customers. If sales from our independent
restaurant customers do not grow at the same rate or a greater rate than sales from these large regional and national customers, our gross margins
may decline. Additional pressure exists on our gross margin from competitive pricing pressures. Low growth in the foodservice market is contributing to
increased competition which is in turn pressuring gross pro ts. We expect this pricing pressure will likely continue. In ation can be a factor that contributes
to gross margin pressure; however, in ation rates remained relatively stable throughout scal 2013 at a rate between 2.0% to 2.5%. In ation was present
in certain product categories such as poultry and meat, but was not signi cant in the majority of our product categories. While we cannot predict whether
in ation will continue at current levels, periods of high in ation, either overall or in certain product categories, can have a negative impact on us and our
customers, as high food costs can reduce consumer spending in the food-away-from-home market, and may negatively impact our sales, gross pro t,
operating income and earnings.
We have experienced higher operating expenses this scal year as compared to scal 2012. Our Business Transformation Project has been a primary
contributor to this increase. This project is a key part of our strategy to control costs and grow our market share over the long-term. This project includes
an integrated software system that went into deployment in August2012, resulting in increased deployment expenses and software amortization. In scal
2012, we were still building and testing our software and therefore had a greater amount of capitalized costs. We believe expenses related to the project in
scal 2014 will be similar to the costs incurred in scal 2013. Operating expenses have also increased due to provisions related to multiemployer pension