Sysco 2013 Annual Report Download - page 32
Download and view the complete annual report
Please find page 32 of the 2013 Sysco annual report below. You can navigate through the pages in the report by either clicking on the pages listed below, or by using the keyword search tool below to find specific information within the annual report.-
 1
1 -
2
-
3
-
4
-
5
-
6
-
7
-
8
-
9
-
10
-
11
-
12
-
13
-
14
-
15
-
16
-
17
-
18
-
19
-
20
-
21
-
 22
22 -
 23
23 -
 24
24 -
 25
25 -
 26
26 -
 27
27 -
 28
28 -
 29
29 -
 30
30 -
 31
31 -
 32
32 -
 33
33 -
 34
34 -
 35
35 -
 36
36 -
 37
37 -
 38
38 -
 39
39 -
 40
40 -
 41
41 -
 42
42 -
43
-
44
-
45
-
46
-
47
-
48
-
49
-
50
-
51
-
52
-
53
-
54
-
55
-
56
-
57
-
58
-
59
-
60
-
61
-
62
-
63
-
64
-
65
-
66
-
67
-
68
-
69
-
70
-
71
-
72
-
73
-
74
-
75
-
76
-
77
-
78
-
79
-
80
-
81
-
82
-
83
-
84
-
85
-
86
-
87
-
88
-
89
-
90
-
91
-
92
-
93
-
94
-
95
-
96
-
97
-
98
-
99
-
100
-
101
 |
 |

SYSCO CORPORATION-Form10-K 21
PARTII
ITEM7Management’s Discussion and Analysis ofFinancial Condition and Results of Operations
Operating Income
Cost of sales primarily includes our product costs, net of vendor consideration, and includes in-bound freight. Operating expenses include the costs of
facilities, product handling, delivery, selling and general and administrative activities. Fuel surcharges are re ected within sales and gross pro t; fuel costs
are re ected within operating expenses.
Fiscal 2013 vs. Fiscal 2012
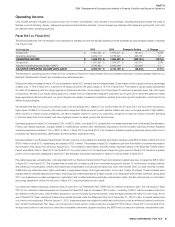
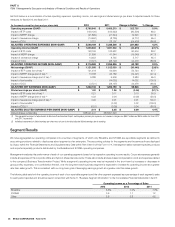
The following table sets forth the change in the components of operating income and adjusted operating income expressed as a percentage increase or decrease
over the prior year:
(Inthousands)
2013 2012 Change inDollars % Change
Gross pro t $ 7,867,591 $ 7,676,577 $ 191,014 2.5%
Operating expenses 6,209,113 5,785,945 423,168 7.3
OPERATING INCOME $ 1,658,478 $ 1,890,632 $ (232,154) (12.3)%
Gross pro t $ 7,867,591 $ 7,676,577 $ 191,014 2.5%
Adjusted operating expenses (Non-GAAP) 5,783,854 5,556,468 227,386 4.1
ADJUSTED OPERATING INCOME (NON-GAAP) $ 2,083,737 $ 2,120,109 $ (36,372) (1.7)%
The decrease in operating income in scal 2013 as compared to scal 2012 was primarily driven by increased expenses, including charges related to our
Business Transformation Project and increased pay-related expenses.
Gross pro t dollars increased in scal 2013 as compared to scal 2012 primarily due to increased sales. Gross margin, which is gross pro t as a percentage
of sales, was 17.72% in scal 2013, a decline of 39 basis points from the gross margin of 18.11% in scal 2012. This decline in gross margin was partially
the result of increased growth from large regional and national customers. Gross margin from these types of customers is generally lower than other types
of customers. As seen in our results during scal 2013, if sales from our independent restaurant customers do not grow at the same rate sales from these
large regional and national customers, our gross margins may decline. Increased competition resulting from a slow-growth market also contributed to the
decline in gross margins.
We estimate that Sysco’s product cost in ation was 2.2% during scal 2013. Based on our product sales mix for scal 2013, we were most impacted by
higher levels of in ation in the poultry and meat product categories. While we cannot predict whether in ation will occur, prolonged periods of high in ation,
either overall or in certain product categories, can have a negative impact on us and our customers, as high food costs can reduce consumer spending
in the food-away-from-home market, and may negatively impact our sales, gross pro t and earnings.
Operating expenses for scal 2013 increased 7.3%, or $423.2million, over scal 2012, primarily due to increased expenses from our Business Transformation
Project, pay-related expenses, charges related to multiemployer pension plan withdrawals, depreciation and amortization expense and fuel. Adjusted
operating expenses increased 4.1%, or $227.4million, in scal 2013 over scal 2012. The increase in adjusted operating expenses was primarily due to
increased pay-related expenses, depreciation and amortization expense and fuel.
Expenses related to our Business Transformation Project, inclusive of pay-related and software amortization expense, were $330.5million in scal 2013 and
$193.1million in scal 2012, representing an increase of $137.4million. The increase in scal 2013 resulted in part from the initiation of software amortization
as the system was placed into service in August2012. The increase in depreciation and amortization expense related to the Business Transformation
Project was $59.6million in scal 2013 over scal 2012. Our project was not in the deployment stage during any period of scal 2012; therefore, a greater
portion of the costs were capitalized in scal 2012. We anticipate that project expenses for scal 2014 will be similar to scal 2013.
Pay-related expenses, excluding labor costs associated with our Business Transformation Project and retirement-related expenses, increased by $48.3million
in scal 2013 over scal 2012. The increase was primarily due to added costs from companies acquired in the last 12months and increased delivery
and warehouse compensation. Delivery and warehouse compensation includes activity-based pay which will increase when our case volumes increase.
Additionally, pay rates have been higher particularly in geographies where oil and gas exploration occurs due to labor shortages. These increases were
partially offset by reduced sales and information technology pay-related expenses as a result of some of our Business Transformation initiatives. During scal
2013, we streamlined our sales management organization and modi ed marketing associate compensation plans. We also restructured our information
technology department during the mid-point of scal 2013, reducing headcount as a result.
Our retirement-related expenses consist primarily of costs from our Retirement Plan, SERP and our de ned contribution plan. The net impact in scal
2013 of our retirement-related expenses as compared to scal 2012 was an increase of $31.3million, consisting of $48.1million increased costs from
the de ned contribution plan, a $20.8million decrease in our net company-sponsored pension costs and approximately $4million for other costs. At the
end of scal 2012, Sysco decided to freeze future bene t accruals under the Retirement Plan as of December31,2012 for all U.S.-based salaried and
non-union hourly employees. Effective January1,2013, these employees were eligible for additional contributions under an enhanced, de ned contribution
plan. Absent the Retirement Plan freeze, net company-sponsored pension costs would have increased $106.9million in scal 2013. During scal 2013,
we approved a plan to restructure our executive nonquali ed retirement program including the SERP and our executive deferred compensation plan.