Sysco 2013 Annual Report Download - page 91
Download and view the complete annual report
Please find page 91 of the 2013 Sysco annual report below. You can navigate through the pages in the report by either clicking on the pages listed below, or by using the keyword search tool below to find specific information within the annual report.-
 1
1 -
2
-
3
-
4
-
5
-
6
-
7
-
8
-
9
-
10
-
11
-
12
-
13
-
14
-
15
-
16
-
17
-
18
-
19
-
20
-
21
-
22
-
23
-
24
-
25
-
26
-
27
-
28
-
29
-
30
-
31
-
32
-
33
-
34
-
35
-
36
-
37
-
38
-
39
-
40
-
41
-
42
-
43
-
44
-
45
-
46
-
47
-
48
-
49
-
50
-
51
-
52
-
53
-
54
-
55
-
56
-
57
-
58
-
59
-
60
-
61
-
62
-
63
-
64
-
65
-
66
-
67
-
68
-
69
-
70
-
71
-
72
-
73
-
74
-
75
-
76
-
77
-
78
-
79
-
80
-
 81
81 -
 82
82 -
 83
83 -
 84
84 -
 85
85 -
 86
86 -
 87
87 -
 88
88 -
 89
89 -
 90
90 -
 91
91 -
 92
92 -
 93
93 -
 94
94 -
 95
95 -
 96
96 -
 97
97 -
 98
98 -
 99
99 -
 100
100 -
 101
101
 |
 |
SYSCO CORPORATION-Form10-K80
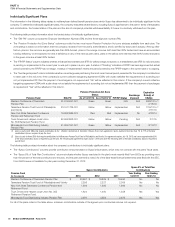
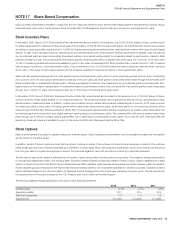
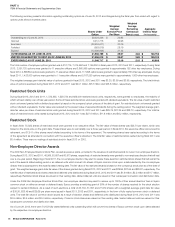
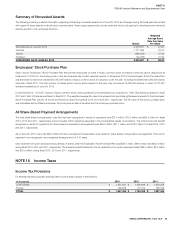
PARTII
ITEM8Financial Statements and Supplementary Data
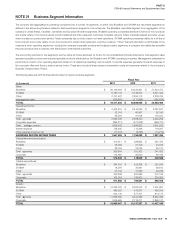
The sales mix for the principal product categories for each scal year is as follows:
(Inthousands)
Fiscal Year
2013 2012 2011
Canned and dry products $ 8,310,634 $ 7,948,187 $ 7,308,893
Fresh and frozen meats 8,242,423 7,929,235 7,163,505
Frozen fruits, vegetables, bakery and other 6,023,990 5,757,871 5,337,625
Dairy products 4,669,986 4,456,634 4,145,350
Poultry 4,580,445 4,188,787 3,912,510
Fresh produce 3,540,027 3,332,504 3,345,929
Paper and disposables 3,364,965 3,295,483 3,055,862
Seafood 2,167,588 2,076,848 1,929,417
Beverage products 1,643,034 1,591,540 1,478,456
Janitorial products 1,013,488 952,569 902,636
Equipment and smallwares 637,680 613,590 581,628
Medical supplies 216,973 237,691 161,678
TOTAL $ 44,411,233 $ 42,380,939 $ 39,323,489
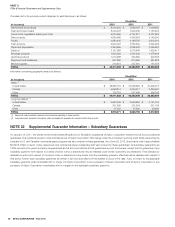
Information concerning geographic areas is as follows:
(Inthousands)
Fiscal Year
2013 2012 2011
Sales:(1)
UnitedStates $ 38,985,715 $ 37,596,862 $ 34,992,273
Canada 4,698,814 4,246,611 3,864,420
Other 726,704 537,466 466,796
TOTAL $ 44,411,233 $ 42,380,939 $ 39,323,489
Long-lived assets:(2)
UnitedStates $ 3,593,346 $ 3,564,854 $ 3,161,724
Canada 307,605 291,304 321,185
Other 77,120 27,592 29,480
TOTAL $ 3,978,071 $ 3,883,750 $ 3,512,389
(1) Represents sales to external customers from businesses operating in these countries.
(2) Long-lived assets represents net property, plant and equipment reported in the country in which they are held.
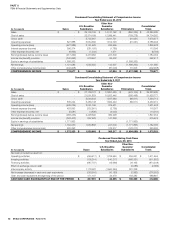
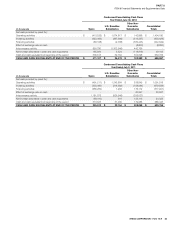
NOTE22 Supplemental Guarantor Information– Subsidiary Guarantees
On January19,2011, the wholly-owned UnitedStates Broadline (U.S. Broadline) subsidiaries of Sysco Corporation entered into full and unconditional
guarantees of all outstanding senior notes and debentures of Sysco Corporation. Borrowings under the company’s revolving credit facility supporting the
company’s U.S. and Canadian commercial paper programs are also covered by these guarantees. As of June29,2013, Sysco had a total of approximately
$2,820.5million in senior notes, debentures and commercial paper outstanding that was covered by these guarantees. All subsidiary guarantors are
100%-owned by the parent company, all guarantees are full and unconditional and all guarantees are joint and several, except that the guarantee of any
subsidiary guarantor with respect to a series of senior notes or debentures may be released under certain customary circumstances. If we exercise our
defeasance option with respect to the senior notes or debentures of any series, then any subsidiary guarantor effectively will be released with respect to
that series. Further, each subsidiary guarantee will remain in full force and effect until the earliest to occur of the date, if any, on which(1) the applicable
subsidiary guarantor shall consolidate with or merge into Sysco Corporation or any successor of Sysco Corporation and(2) Sysco Corporation or any
successor of Sysco Corporation consolidates with or merges into the applicable subsidiary guarantor.