Sysco 2013 Annual Report Download - page 93
Download and view the complete annual report
Please find page 93 of the 2013 Sysco annual report below. You can navigate through the pages in the report by either clicking on the pages listed below, or by using the keyword search tool below to find specific information within the annual report.-
 1
1 -
2
-
3
-
4
-
5
-
6
-
7
-
8
-
9
-
10
-
11
-
12
-
13
-
14
-
15
-
16
-
17
-
18
-
19
-
20
-
21
-
22
-
23
-
24
-
25
-
26
-
27
-
28
-
29
-
30
-
31
-
32
-
33
-
34
-
35
-
36
-
37
-
38
-
39
-
40
-
41
-
42
-
43
-
44
-
45
-
46
-
47
-
48
-
49
-
50
-
51
-
52
-
53
-
54
-
55
-
56
-
57
-
58
-
59
-
60
-
61
-
62
-
63
-
64
-
65
-
66
-
67
-
68
-
69
-
70
-
71
-
72
-
73
-
74
-
75
-
76
-
77
-
78
-
79
-
80
-
81
-
82
-
 83
83 -
 84
84 -
 85
85 -
 86
86 -
 87
87 -
 88
88 -
 89
89 -
 90
90 -
 91
91 -
 92
92 -
 93
93 -
 94
94 -
 95
95 -
 96
96 -
 97
97 -
 98
98 -
 99
99 -
 100
100 -
 101
101
 |
 |

SYSCO CORPORATION-Form10-K82
PARTII
ITEM8Financial Statements and Supplementary Data
(Inthousands)
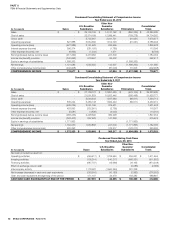
Condensed Consolidating Statement of Comprehensive Income
Year Ended June30,2012
Sysco U.S. Broadline
Subsidiaries
Other Non-
Guarantor
Subsidiaries Eliminations Consolidated
Totals
Sales $ - $ 29,100,106 $ 14,131,162 $ (850,329) $ 42,380,939
Cost of sales - 23,374,199 12,089,441 (759,278) 34,704,362
Gross pro t - 5,725,907 2,041,721 (91,051) 7,676,577
Operating expenses 527,888 3,534,382 1,814,726 (91,051) 5,785,945
Operating income (loss) (527,888) 2,191,525 226,995 - 1,890,632
Interest expense (income) 396,374 (281,193) (1,785) - 113,396
Other expense (income), net (6,993) (1,244) 1,471 - (6,766)
Earnings (losses) before income taxes (917,269) 2,473,962 227,309 - 1,784,002
Income tax (bene t) provision (340,592) 918,607 84,402 - 662,417
Equity in earnings of subsidiaries 1,698,262 - - (1,698,262) -
Net earnings 1,121,585 1,555,355 142,907 (1,698,262) 1,121,585
Other comprehensive income (loss) (402,908) - (81,003) 81,003 (402,908)
COMPREHENSIVE INCOME $ 718,677 $ 1,555,355 $ 61,904 $ (1,617,259) $ 718,677
(Inthousands)
Condensed Consolidating Statement of Comprehensive Income
Year Ended July2,2011
Sysco U.S. Broadline
Subsidiaries
Other Non-
Guarantor
Subsidiaries Eliminations Consolidated
Totals
Sales $ - $ 27,138,172 $ 12,861,426 $ (676,109) $ 39,323,489
Cost of sales - 21,591,829 10,923,446 (586,498) 31,928,777
Gross pro t - 5,546,343 1,937,980 (89,611) 7,394,712
Operating expenses 535,224 3,455,148 1,562,449 (89,611) 5,463,210
Operating income (loss) (535,224) 2,091,195 375,531 - 1,931,502
Interest expense (income) 453,593 (332,561) (2,765) - 118,267
Other expense (income), net (5,581) (4,636) (4,002) - (14,219)
Earnings (losses) before income taxes (983,236) 2,428,392 382,298 - 1,827,454
Income tax (bene t) provision (363,403) 897,529 141,298 - 675,424
Equity in earnings of subsidiaries 1,771,863 - - (1,771,863) -
Net earnings 1,152,030 1,530,863 241,000 (1,771,863) 1,152,030
Other comprehensive income (loss) 220,293 - 122,217 (122,217) 220,293
COMPREHENSIVE INCOME $ 1,372,323 $ 1,530,863 $ 363,217 $ (1,894,080) $ 1,372,323
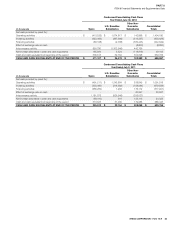
(Inthousands)
Condensed Consolidating Cash Flows
Year Ended June29,2013
Sysco U.S. Broadline
Subsidiaries
Other Non-
Guarantor
Subsidiaries Consolidated
Totals
Net cash provided by (used for):
Operating activities $ (449,417) $ 1,705,950 $ 255,061 $ 1,511,594
Investing activities (105,314) (140,217) (666,351) (911,882)
Financing activities (887,707) (15,666) 29,165 (874,208)
Effect of exchange rate on cash - - (2,086) (2,086)
Intercompany activity 1,178,922 (1,560,250) 381,328 -
Net increase (decrease) in cash and cash equivalents (263,516) (10,183) (2,883) (276,582)
Cash and cash equivalents at beginning of the period 471,107 34,478 183,282 688,867
CASH AND CASH EQUIVALENTS AT END OF THE PERIOD $ 207,591 $ 24,295 $ 180,399 $ 412,285