Sysco 2013 Annual Report Download - page 34
Download and view the complete annual report
Please find page 34 of the 2013 Sysco annual report below. You can navigate through the pages in the report by either clicking on the pages listed below, or by using the keyword search tool below to find specific information within the annual report.-
 1
1 -
2
-
3
-
4
-
5
-
6
-
7
-
8
-
9
-
10
-
11
-
12
-
13
-
14
-
15
-
16
-
17
-
18
-
19
-
20
-
21
-
22
-
23
-
 24
24 -
 25
25 -
 26
26 -
 27
27 -
 28
28 -
 29
29 -
 30
30 -
 31
31 -
 32
32 -
 33
33 -
 34
34 -
 35
35 -
 36
36 -
 37
37 -
 38
38 -
 39
39 -
 40
40 -
 41
41 -
 42
42 -
 43
43 -
 44
44 -
45
-
46
-
47
-
48
-
49
-
50
-
51
-
52
-
53
-
54
-
55
-
56
-
57
-
58
-
59
-
60
-
61
-
62
-
63
-
64
-
65
-
66
-
67
-
68
-
69
-
70
-
71
-
72
-
73
-
74
-
75
-
76
-
77
-
78
-
79
-
80
-
81
-
82
-
83
-
84
-
85
-
86
-
87
-
88
-
89
-
90
-
91
-
92
-
93
-
94
-
95
-
96
-
97
-
98
-
99
-
100
-
101
 |
 |
SYSCO CORPORATION-Form10-K 23
PARTII
ITEM7Management’s Discussion and Analysis ofFinancial Condition and Results of Operations
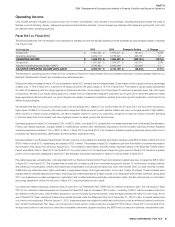
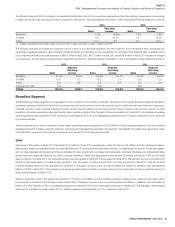
Gross pro t dollars increased in scal 2012 as compared to scal 2011 primarily due to increased sales. Gross margin, which is gross pro t as a percentage
of sales, was 18.11% in scal 2012, a decline of 69 basis points from the gross margin of 18.80% in scal 2011. This decline in gross margin was primarily
the result of product cost in ation. Other factors contributing to our gross margin decline were competitive pressures on pricing, segment mix changes
where certain of our lower margin segments grew faster than our Broadline segment and our own strategy to gain market share.
Sysco’s product cost in ation was estimated as in ation of 5.5% during scal 2012. Based on our product sales mix for scal 2012, we were most impacted
by higher levels of in ation in themeat, canned and dry and frozen product categories in the range of 6% to 8%. Our product cost in ation reached a high
of 7.3% in the rst quarter of scal 2012 and a low of 3.3% in the fourth quarter of scal 2012. While we are generally able to pass through modest levels
of in ation to our customers, we were unable to fully pass through these higher levels of product cost in ation with the same gross margin in these product
categories without negatively impacting our customers’ business and therefore our business.
Gross pro t dollars for scal 2012also increased as a result of higher fuel surcharges. Fuel surcharges were approximately $47.5million higher in scal
2012 than in scal 2011 due to higher fuel prices incurred during scal 2012 and the application of fuel surcharges to a broader customer base for the
entire scal period.
Operating expenses for scal 2012 increased 5.9% primarily due to increased pay-related expenses, increased expenses related to our Business Transformation
Project, increased fuel costs and an unfavorable year-over-year comparison on the amounts recorded to adjust the carrying value of COLI policies to their
cash surrender values as compared to the prior year period. These increases were partially offset by decreases in net company-sponsored pension costs
and lower provisions related to multiemployer pension plans. Adjusted operating expenses increased 4.2%, or $221.7million, in scal 2012 over scal 2011.
Pay-related expenses, excluding labor costs associated with our Business Transformation Project, increased by $153.7million in scal 2012 over scal 2011.
The increase was primarily due to increased sales and delivery compensation and added costs from companies acquired within the last 12months. Sales
compensation includes commissions which are driven by gross pro t dollars and case volumes, and delivery compensation includes activity-based pay
which is driven by case volumes. Since these driverswere variable in nature, increased gross pro t dollars and cases volumes increased sales and delivery
compensation. Also contributing to the increase in pay-related expenses was an increase in severance incurred in scal 2012 over scal 2011 of $5.7million.
Expenses related to our Business Transformation Project, inclusive of pay-related expense, were $193.1million in scal 2012 and $102.6million in scal 2011,
representing an increase of $90.5million. The increase in scal 2012 resulted from increased project spending, reduced capitalization of expendituresand
expenses due to the ramp up of our shared services center.
Fuel costs increased by $39.8million in scal 2012 over scal 2011 primarily due to increased contracted and market diesel prices. Our costs per gallon
increased13.0% in scal 2012 over scal 2011. Our fuel commitments will result in either additional fuel costs or avoided fuel costs based on the comparison
of the prices on the xed price contracts and market prices for the respective periods. In scal 2012, the forward purchase commitments resulted in an
estimated $20.2million of avoided fuel costs as the xed price contracts were generally lower than market prices for the contracted volumes. In scal
2011, the forward purchase commitments resulted in an estimated $16.4million of avoided fuel costs as the xed price contracts were generally lower
than market prices for the contracted volumes.
We adjust the carrying values of our COLI policies to their cash surrender values on an ongoing basis. The cash surrender values of these policies are
largely based on the values of underlying investments, which through scal 2011 included publicly traded securities. As a result, the cash surrender values
of these policies uctuated with changes in the market value of such securities. The changes in the nancial markets resulted in gains for these policies of
$28.2million in scal 2011. Near the end of scal 2011, we reallocated all of our policies into low-risk, xed-income securities to reduce earnings volatility
and therefore our adjustments for scal 2012 were not signi cant.
Net company-sponsored pension costs in scal 2012 were $27.3million lower than in scal 2011. The decrease in scal 2012 was due primarily to higher
returns on assets of Sysco’s Retirement Plan obtained in scal 2011.
From time to time, we may voluntarily withdraw from multiemployer pension plans to minimize or limit our future exposure to these plans. In the last two
scal years, we voluntary withdrew from several multiemployer plans and recorded provisions of $21.9million in scal 2012 and $41.5million in scal 2011.
Our scal 2012, our Broadline companies cost per case increased approximately $0.04 per case as compared to scal 2011 primarily from increased
pay-related expenses and higher fuel costs.
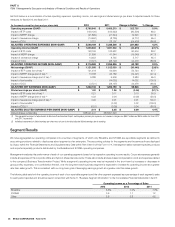
Net Earnings
Net earnings decreased 11.5% in scal 2013 from scal 2012 due primarily to the changes in operating income discussed above. Adjusted net earnings
increased 0.1% in scal 2013. The increase in adjusted net earnings in scal 2013 was primarily from increased gross pro ts, partially offset by increases
in adjusted operating expenses that were primarily due to increased pay-related expenses, depreciation and amortization expense and fuel.
Net earnings for scal 2012decreased 2.6% over scal 2011. This decrease was primarily due to changes in operating income discussed above. Adjusted
net earnings increased4.6% during scal 2012.