Sysco 2013 Annual Report Download - page 69
Download and view the complete annual report
Please find page 69 of the 2013 Sysco annual report below. You can navigate through the pages in the report by either clicking on the pages listed below, or by using the keyword search tool below to find specific information within the annual report.-
 1
1 -
2
-
3
-
4
-
5
-
6
-
7
-
8
-
9
-
10
-
11
-
12
-
13
-
14
-
15
-
16
-
17
-
18
-
19
-
20
-
21
-
22
-
23
-
24
-
25
-
26
-
27
-
28
-
29
-
30
-
31
-
32
-
33
-
34
-
35
-
36
-
37
-
38
-
39
-
40
-
41
-
42
-
43
-
44
-
45
-
46
-
47
-
48
-
49
-
50
-
51
-
52
-
53
-
54
-
55
-
56
-
57
-
58
-
 59
59 -
 60
60 -
 61
61 -
 62
62 -
 63
63 -
 64
64 -
 65
65 -
 66
66 -
 67
67 -
 68
68 -
 69
69 -
 70
70 -
 71
71 -
 72
72 -
 73
73 -
 74
74 -
 75
75 -
 76
76 -
 77
77 -
 78
78 -
 79
79 -
80
-
81
-
82
-
83
-
84
-
85
-
86
-
87
-
88
-
89
-
90
-
91
-
92
-
93
-
94
-
95
-
96
-
97
-
98
-
99
-
100
-
101
 |
 |
SYSCO CORPORATION-Form10-K58
PARTII
ITEM8Financial Statements and Supplementary Data
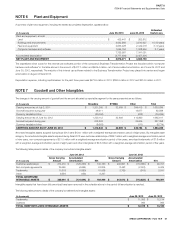
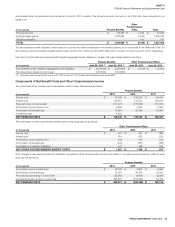
Amortization expense for the past three years was $32.1million in 2013, $24.9million in 2012 and $21.9million in 2011. The estimated future amortization expense
for the next ve scal years on intangible assets outstanding as of June29,2013 is shown below:
(Inthousands)
Amount
2014 $ 40,999
2015 36,581
2016 29,150
2017 24,515
2018 21,068
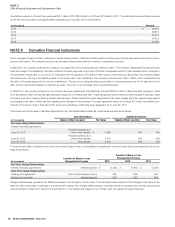
NOTE8 Derivative Financial Instruments
Sysco manages its debt portfolio to achieve an overall desired position of xed and oating rates and may employ interest rate swaps from time to time to
achieve this position. The company does not use derivative nancial instruments for trading or speculative purposes.
In May2012, the company entered into a treasury lock agreement with a notional amount of $200.0million. The company designated this derivative as a
cash ow hedge of the variability in the cash out ows of interest payments on a portion of the then forecasted June2012 debt issuance due to changes in
the benchmark interest rate. In June2012, in conjunction with the issuance of the $450.0million senior notes maturing in scal 2022, the company settled
the treasury lock, locking in the effective yields on the related debt. Upon settlement, the company received cash of $0.7million, which represented the
fair value of the swap agreement at the time of settlement. This amount is being amortized as an offset to interest expense over the 10-year term of the
debt, and the unamortized balance is re ected as a gain, net of tax, in accumulated other comprehensive loss.
In scal 2010, the company entered into two interest rate swap agreements that effectively converted $250.0million of xed rate debt maturing in scal
2013 and $200.0million of xed rate debt maturing in scal 2014 to oating rate debt. These transactions were entered into with the goal of reducing overall
borrowing cost and increasing oating interest rate exposure. These transactions were designated as fair value hedges since the swaps hedge against
the changes in fair value of xed rate debt resulting from changes in interest rates. The swap agreement related to the scal 2013 debt was settled upon
maturity of the senior notes in February2013, leaving one remaining outstanding swap agreement as of June29,2013.
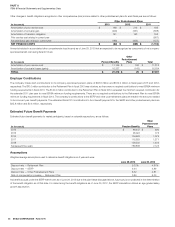
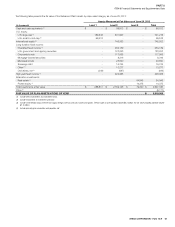
The location and the fair value of derivative instruments in the consolidated balance sheet as of each scal year-end are as follows:
(Inthousands)
Asset Derivatives Liability Derivatives
Balance Sheet Location Fair Value Balance Sheet Location Fair Value
Fair Value Hedge Relationships:
Interest rate swap agreements
June29,2013
Prepaid expenses and
othercurrentassets $ 2,988 N/A N/A
June30,2012
Prepaid expenses and
othercurrentassets 2,475 N/A N/A
June30,2012 Other assets 6,219 N/A N/A
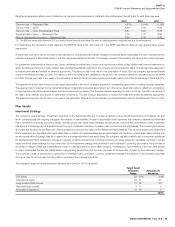
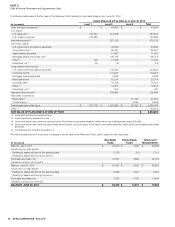
The location and effect of derivative instruments and related hedged items on consolidated comprehensive income for each scal year presented on a pre-tax
basis are as follows:
(Inthousands)
Location of (Gain) or Loss
Recognizedin Income
Amount of (Gain) or Loss
Recognized in Income
2013 2012 2011
Fair Value Hedge Relationships:
Interest rate swap agreements Interest expense $ (4,492) $ (7,900) $ (9,026)
Cash Flow Hedge Relationships:
Treasury lock agreement Other comprehensive income N/A (722) N/A
Interest rate contracts Interest expense 626 692 696
Hedge ineffectiveness represents the difference between the changes in the fair value of the derivative instruments and the changes in fair value of the
xed rate debt attributable to changes in the benchmark interest rate. Hedge ineffectiveness is recorded directly in earnings within interest expense and
was immaterial for scal 2013, scal 2012 and scal 2011. The interest rate swaps do not contain credit-risk-related contingent features.