Sysco 2013 Annual Report Download - page 68
Download and view the complete annual report
Please find page 68 of the 2013 Sysco annual report below. You can navigate through the pages in the report by either clicking on the pages listed below, or by using the keyword search tool below to find specific information within the annual report.-
 1
1 -
2
-
3
-
4
-
5
-
6
-
7
-
8
-
9
-
10
-
11
-
12
-
13
-
14
-
15
-
16
-
17
-
18
-
19
-
20
-
21
-
22
-
23
-
24
-
25
-
26
-
27
-
28
-
29
-
30
-
31
-
32
-
33
-
34
-
35
-
36
-
37
-
38
-
39
-
40
-
41
-
42
-
43
-
44
-
45
-
46
-
47
-
48
-
49
-
50
-
51
-
52
-
53
-
54
-
55
-
56
-
57
-
 58
58 -
 59
59 -
 60
60 -
 61
61 -
 62
62 -
 63
63 -
 64
64 -
 65
65 -
 66
66 -
 67
67 -
 68
68 -
 69
69 -
 70
70 -
 71
71 -
 72
72 -
 73
73 -
 74
74 -
 75
75 -
 76
76 -
 77
77 -
 78
78 -
79
-
80
-
81
-
82
-
83
-
84
-
85
-
86
-
87
-
88
-
89
-
90
-
91
-
92
-
93
-
94
-
95
-
96
-
97
-
98
-
99
-
100
-
101
 |
 |
SYSCO CORPORATION-Form10-K 57
PARTII
ITEM8Financial Statements and Supplementary Data
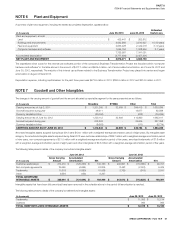
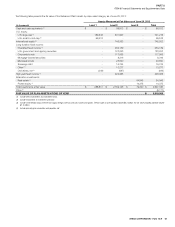
NOTE6 Plant and Equipment
A summary of plant and equipment, including the related accumulated depreciation, appears below:
(Inthousands)
June29,2013 June30,2012 Estimated
Useful Lives
Plant and equipment, at cost:
Land $ 435,447 $ 352,812
Buildings and improvements 3,632,568 3,510,627 10-30 years
Fleet and equipment 2,633,228 2,449,018 3-10 years
Computer hardware and software 1,054,754 1,028,594 3-7 years
7,755,997 7,341,051
Accumulated depreciation (3,777,926) (3,457,301)
NET PLANT AND EQUIPMENT $ 3,978,071 $ 3,883,750
The capitalized direct costs for the internal use software portion of the company’s Business Transformation Project are included within “computer
hardware and software” in the table above in the amount of $417.7million and $469.4million, net of accumulated amortization, as of June29,2013 and
June30,2012, respectively. The majority of this internal use software related to the Business Transformation Project was placed into service and began
amortization in Augustof scal 2013.
Depreciation expense, including capital leases, for the past three years was $473.5million in 2013, $384.9million in 2012 and $374.0million in 2011.
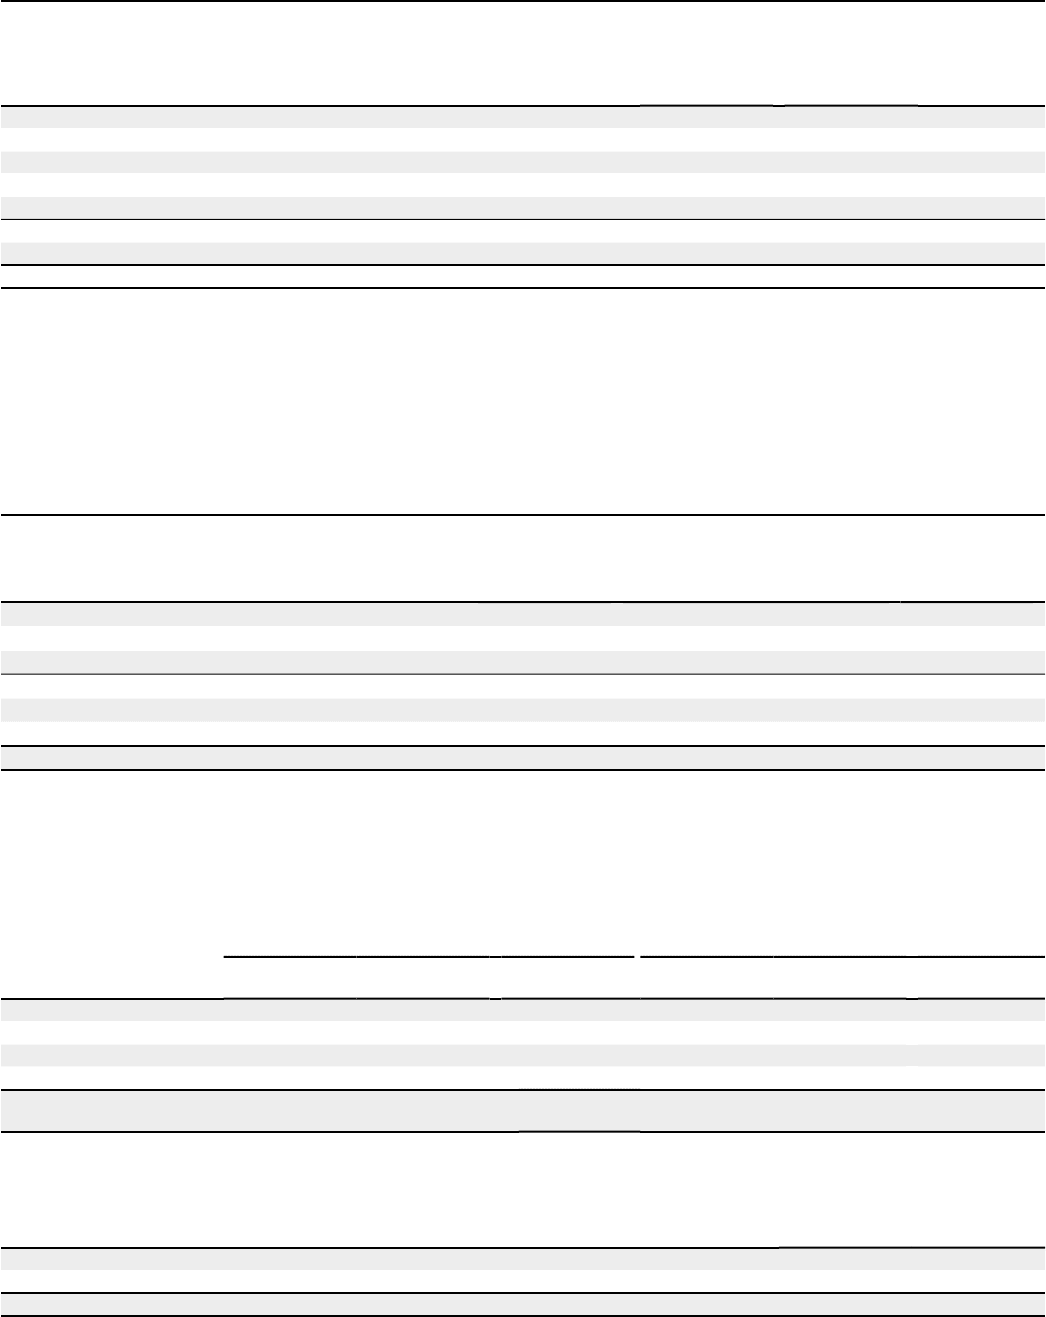
NOTE7 Goodwill and Other Intangibles
The changes in the carrying amount of goodwill and the amount allocated by reportable segment for the years presented are as follows:
(Inthousands)
Broadline SYGMA Other Total
Carrying amount as of July2,2011 $ 1,201,265 $ 32,609 $ 399,415 $ 1,633,289
Goodwill acquired during year 48,911 - 13,677 62,588
Currency translation/other (30,064) - (202) (30,266)
Carrying amount as of June30,2012 1,220,112 32,609 412,890 1,665,611
Goodwill acquired during year 203,393 - 24,005 227,398
Currency translation/other (8,663) - (111) (8,774)
CARRYING AMOUNT AS OF JUNE29,2013 $ 1,414,842 $ 32,609 $ 436,784 $ 1,884,235
Amortized intangible assets acquired during scal 2013 were $124.1million with a weighted-average amortization period of eight years. By intangible asset
category, the amortized intangible assets acquired during scal 2013 were customer relationships of $85.7million with a weighted-average amortization period
of nine years, non-compete agreements of $21.0million with a weighted-average amortization period of ve years, amortized trademarks of $7.8million
with a weighted-average amortization period of eight years and other intangibles of $9.6million with a weighted-average amortization period of ve years.
The following table presents details of the company’s amortized intangible assets:
(Inthousands)
June29,2013 June30,2012
Gross Carrying
Amount Accumulated
Amortization Net Gross Carrying
Amount Accumulated
Amortization Net
Customer relationships $ 274,410 $ (125,250) $ 149,160 $ 200,801 $ (110,080) $ 90,721
Non-compete agreements 29,460 (4,655) 24,805 8,453 (2,024) 6,429
Trademarks 11,618 (1,580) 10,038 3,759 (518) 3,241
Other 9,556 (159) 9,397 - - -
TOTAL AMORTIZED
INTANGIBLE ASSETS $ 325,044 $ (131,644) $ 193,400 $ 213,013 $ (112,622) $ 100,391
Intangible assets that have been fully amortized have been removed in the schedule above in the period full amortization is reached.
The following table presents details of the company’s inde nite-lived intangible assets:
(Inthousands)
June29,2013 June30,2012
Trademarks $ 11,353 $ 12,214
Licenses 966 966
TOTAL INDEFINITE-LIVED INTANGIBLE ASSETS $ 12,319 $ 13,180