Sysco 2013 Annual Report Download - page 79
Download and view the complete annual report
Please find page 79 of the 2013 Sysco annual report below. You can navigate through the pages in the report by either clicking on the pages listed below, or by using the keyword search tool below to find specific information within the annual report.-
 1
1 -
2
-
3
-
4
-
5
-
6
-
7
-
8
-
9
-
10
-
11
-
12
-
13
-
14
-
15
-
16
-
17
-
18
-
19
-
20
-
21
-
22
-
23
-
24
-
25
-
26
-
27
-
28
-
29
-
30
-
31
-
32
-
33
-
34
-
35
-
36
-
37
-
38
-
39
-
40
-
41
-
42
-
43
-
44
-
45
-
46
-
47
-
48
-
49
-
50
-
51
-
52
-
53
-
54
-
55
-
56
-
57
-
58
-
59
-
60
-
61
-
62
-
63
-
64
-
65
-
66
-
67
-
68
-
 69
69 -
 70
70 -
 71
71 -
 72
72 -
 73
73 -
 74
74 -
 75
75 -
 76
76 -
 77
77 -
 78
78 -
 79
79 -
 80
80 -
 81
81 -
 82
82 -
 83
83 -
 84
84 -
 85
85 -
 86
86 -
 87
87 -
 88
88 -
 89
89 -
90
-
91
-
92
-
93
-
94
-
95
-
96
-
97
-
98
-
99
-
100
-
101
 |
 |

SYSCO CORPORATION-Form10-K68
PARTII
ITEM8Financial Statements and Supplementary Data
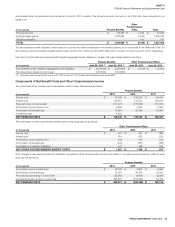
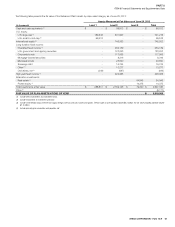
The following table presents the fair value of the Retirement Plan’s assets by major asset category as of June30,2012:
(Inthousands)
Assets Measured at Fair Value as of June30,2012
Level1 Level2 Level3 Total
Cash and cash equivalents(1) $ - $ 44,904 $ - $ 44,904
U.S. equity:
U.S. large-cap(1) 143,544 414,048 - 557,592
U.S. small-to-mid-cap 133,388 - - 133,388
International equity(2) - 670,139 - 670,139
Core xed income:
U.S. government and agency securities - 43,690 - 43,690
Corporate bonds(1) - 85,391 - 85,391
Asset-backed securities - 11,937 - 11,937
Mortgage-backed securities, net(1) - 106,722 - 106,722
Other(1) 192 17,248 - 17,440
Derivatives, net(3) (16) (6) - (22)
Long duration xed income:
U.S. government and agency securities - 143,825 - 143,825
Corporate bonds - 119,947 - 119,947
Mortgage-backed securities - 9,946 - 9,946
Municipal bonds - 22,014 - 22,014
Sovereign debt - 18,126 - 18,126
Other(1) - 12,813 - 12,813
Derivatives, net(4) - (43) - (43)
High yield xed income(2) - 205,984 - 205,984
Alternative investments:
Real estate(2) - - 51,097 51,097
Private equity(2) - - 5,295 5,295
Total investments at fair value $ 277,108 $ 1,926,685 $ 56,392 $ 2,260,185
Other(5) (25,316)
FAIR VALUE OF PLAN ASSETS AT END OF YEAR $ 2,234,869
(1) Include direct investments and investment funds.
(2) Include investments in investment funds only.
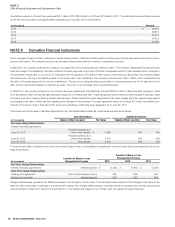
(3) Include credit default swaps, interest rate swaps and futures. The fair value of asset positions totaled $0.3million; the fair value of liability positions totaled $0.3million.
(4) Include credit default swaps, interest rate swaps, foreign currency contracts, futures and options. The fair value of asset positions totaled $0.5million; the fair value of liability positions totaled
$0.6million.
(5) Include primarily plan receivables and payables, net.
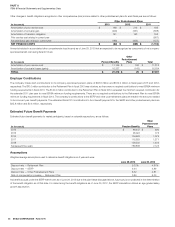
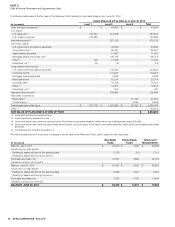
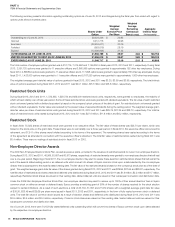
The following table sets forth a summary of changes in the fair value of the Retirement Plan’s Level3 assets for each scal year:
(Inthousands)
Real Estate
Funds Private Equity
Funds Total Level3
Measurements
Balance, July2,2011 $ 30,615 $ 1,480 $ 32,095
Actual return on plan assets:
Relating to assets still held at the reporting date 2,155 (14) 2,141
Relating to assets sold during the period - - -
Purchases and sales, net 18,327 3,829 22,156
Transfers in and/or out of Level3 - - -
Balance, June30,2012 $ 51,097 $ 5,295 $ 56,392
Actual return on plan assets:
Relating to assets still held at the reporting date 6,696 1,327 8,023
Relating to assets sold during the period - - -
Purchases and sales, net 7,052 7,753 14,805
Transfers in and/or out of Level3 - - -
BALANCE, JUNE29,2013 $ 64,845 $ 14,375 $ 79,220