Sysco 2013 Annual Report Download - page 60
Download and view the complete annual report
Please find page 60 of the 2013 Sysco annual report below. You can navigate through the pages in the report by either clicking on the pages listed below, or by using the keyword search tool below to find specific information within the annual report.-
 1
1 -
2
-
3
-
4
-
5
-
6
-
7
-
8
-
9
-
10
-
11
-
12
-
13
-
14
-
15
-
16
-
17
-
18
-
19
-
20
-
21
-
22
-
23
-
24
-
25
-
26
-
27
-
28
-
29
-
30
-
31
-
32
-
33
-
34
-
35
-
36
-
37
-
38
-
39
-
40
-
41
-
42
-
43
-
44
-
45
-
46
-
47
-
48
-
49
-
 50
50 -
 51
51 -
 52
52 -
 53
53 -
 54
54 -
 55
55 -
 56
56 -
 57
57 -
 58
58 -
 59
59 -
 60
60 -
 61
61 -
 62
62 -
 63
63 -
 64
64 -
 65
65 -
 66
66 -
 67
67 -
 68
68 -
 69
69 -
 70
70 -
71
-
72
-
73
-
74
-
75
-
76
-
77
-
78
-
79
-
80
-
81
-
82
-
83
-
84
-
85
-
86
-
87
-
88
-
89
-
90
-
91
-
92
-
93
-
94
-
95
-
96
-
97
-
98
-
99
-
100
-
101
 |
 |
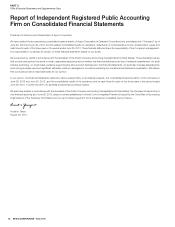
SYSCO CORPORATION-Form10-K 49
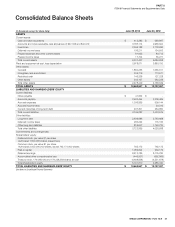
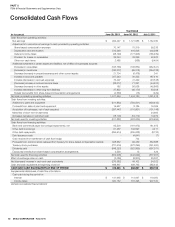
PARTII
ITEM8Financial Statements and Supplementary Data
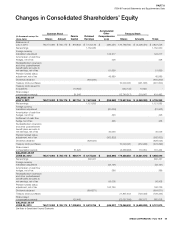
Changes in Consolidated Shareholders’ Equity
(Inthousands except for
share data)
Common Stock Paid-in
Capital Retained
Earnings
Accumulated
Other
Comprehensive
Loss
Treasury Stock
TotalsShares Amount Shares Amounts
Balance as of
July3,2010 765,174,900 $ 765,175 $ 816,833 $ 7,134,139 $ (480,251) 176,768,795 $ (4,408,370) $ 3,827,526
Net earnings
1,152,030 1,152,030
Foreign currency
translation adjustment
122,217 122,217
Amortization of cash ow
hedges, net of tax 428 428
Reclassi cation of pension
and other postretirement
bene t plans amounts to
net earnings, net of tax 51,659 51,659
Pension funded status
adjustment, net of tax 45,989 45,989
Dividends declared
(604,500) (604,500)
Treasury stock purchases 10,000,000 (291,600) (291,600)
Treasury stock issued for
acquisitions (10,625)
(422,132) 10,625 -
Share-based
compensation awards 81,546 (12,749,317) 319,947 401,493
BALANCE AS OF
JULY2,2011 765,174,900 $ 765,175 $ 887,754 $ 7,681,669 $ (259,958) 173,597,346 $ (4,369,398) $ 4,705,242
Net earnings
1,121,585 1,121,585
Foreign currency
translation adjustment
(81,003) (81,003)
Amortization of cash ow
hedges, net of tax 426 426
Settlement of cash ow
hedge, net of tax 445 445
Reclassi cation of pension
and other postretirement
bene t plans amounts to
net earnings, net of tax 40,046 40,046
Pension funded status
adjustment, net of tax (362,822) (362,822)
Dividends declared
(628,024) (628,024)
Treasury stock purchases 10,000,000 (272,299) (272,299)
Share-based
compensation awards 51,425 (4,368,963) 110,019 161,444
BALANCE AS OF
JUNE30,2012 765,174,900 $ 765,175 $ 939,179 $ 8,175,230 $ (662,866) 179,228,383 $ (4,531,678) $ 4,685,040
Net earnings
992,427 992,427
Foreign currency
translation adjustment
(33,191) (33,191)
Amortization of cash ow
hedges, net of tax 386 386
Reclassi cation of pension
and other postretirement
bene t plans amounts to
net earnings, net of tax 56,008 56,008
Pension funded status
adjustment, net of tax 192,726 192,726
Dividends declared
(654,871) (654,871)
Treasury stock purchases 21,897,403 (729,333) (729,333)
Share-based
compensation awards 120,445 (22,057,356) 562,173 682,618
BALANCE AS OF
JUNE29,2013 765,174,900 $ 765,175 $ 1,059,624 $ 8,512,786 $ (446,937) 179,068,430 $ (4,698,838) $ 5,191,810
See Notes to Consolidated Financial Statements