Sysco 2013 Annual Report Download - page 31
Download and view the complete annual report
Please find page 31 of the 2013 Sysco annual report below. You can navigate through the pages in the report by either clicking on the pages listed below, or by using the keyword search tool below to find specific information within the annual report.-
 1
1 -
2
-
3
-
4
-
5
-
6
-
7
-
8
-
9
-
10
-
11
-
12
-
13
-
14
-
15
-
16
-
17
-
18
-
19
-
20
-
 21
21 -
 22
22 -
 23
23 -
 24
24 -
 25
25 -
 26
26 -
 27
27 -
 28
28 -
 29
29 -
 30
30 -
 31
31 -
 32
32 -
 33
33 -
 34
34 -
 35
35 -
 36
36 -
 37
37 -
 38
38 -
 39
39 -
 40
40 -
 41
41 -
42
-
43
-
44
-
45
-
46
-
47
-
48
-
49
-
50
-
51
-
52
-
53
-
54
-
55
-
56
-
57
-
58
-
59
-
60
-
61
-
62
-
63
-
64
-
65
-
66
-
67
-
68
-
69
-
70
-
71
-
72
-
73
-
74
-
75
-
76
-
77
-
78
-
79
-
80
-
81
-
82
-
83
-
84
-
85
-
86
-
87
-
88
-
89
-
90
-
91
-
92
-
93
-
94
-
95
-
96
-
97
-
98
-
99
-
100
-
101
 |
 |

SYSCO CORPORATION-Form10-K20
PARTII
ITEM7Management’s Discussion and Analysis ofFinancial Condition and Results of Operations
Results of Operations
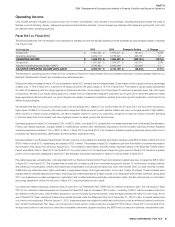
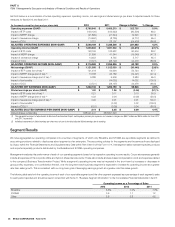
The following table sets forth the components of our consolidated results of operations expressed as a percentage of sales for the periods indicated:
2013 2012 2011
Sales 100.0% 100.0% 100.0%
Cost of sales 82.3 81.9 81.2
Gross pro t 17.7 18.1 18.8
Operating expenses 14.0 13.6 13.9
Operating income 3.7 4.5 4.9
Interest expense 0.3 0.3 0.3
Other expense (income), net (0.0) (0.0) (0.0)
Earnings before income taxes 3.4 4.2 4.6
Income taxes 1.2 1.6 1.7
NET EARNINGS 2.2% 2.6% 2.9%
The following table sets forth the change in the components of our consolidated results of operations expressed as a percentage increase or decrease over the
prior year:
2013 2012
Sales 4.8% 7.8%
Cost of sales 5.3 8.7
Gross pro t 2.5 3.8
Operating expenses 7.3 5.9
Operating income (12.3) (2.1)
Interest expense 13.3 (4.1)
Other expense (income), net 158.2(1) (52.4)(1)
Earnings before income taxes (13.3) (2.4)
Income taxes (16.2) (1.9)
NET EARNINGS (11.5)% (2.6)%
BASIC EARNINGS PER SHARE (12.0)% (2.6)%
DILUTED EARNINGS PER SHARE (12.1) (3.1)
Averageshares outstanding 0.3 0.2
Dilutedshares outstanding 0.6 0.1
(1) Other expense (income), net was income of $17.5million in fiscal 2013, $6.8million in fiscal 2012and $14.2million in fiscal 2011.
Sales
Sales for scal 2013 were 4.8% higher than scal 2012. Sales for scal 2013 increased as a result of product cost in ation and the resulting increase in
selling prices, sales from acquisitions that occurred within the last 12months and case volume growth. Our sales growth in scal 2013 was greater with
our large regional and national customers as compared to sales growth with our independent restaurant customers. We believe our independent sales
growth has been negatively in uenced by lower consumer sentiment. Case volumes excluding acquisitions within the last 12months improved 1.3% in scal
2013. Our case volumes represent our results from our Broadline and SYGMA segments only. Sales from acquisitions within the last 12months favorably
impacted sales by 1.5% for scal 2013. Our acquisition activity has been greater in scal 2013 as compared to scal 2012. We estimate the carryover
impact into scal 2014 will cause sales to increase by approximately 1.0%. We expect to continue the trend of closing acquisitions in scal 2014 that will
continue to add at least 1.0% in total annualized sales from new acquisitions in scal 2014. Changes in product costs, an internal measure of in ation or
de ation, were estimated as in ation of 2.2% during scal 2013. Case volumes including acquisitions within the last 12months improved approximately
2.6% in scal 2013. The changes in the exchange rates used to translate our foreign sales into U.S. dollars did not have a signi cant impacton sales when
compared to scal 2012.
Sales for scal 2012 were 7.8% higherthan scal 2011. Sales for scal 2012increased as a result of product cost in ation, and the resulting increase in
selling prices, along with improving case volumes. Changes in product cost, an internal measure of in ation, were approximately 5.5% during scal 2012.
Case volumes including acquisitions within the last 12months improved approximately 3.0% during scal 2012. Case volumes excluding acquisitions
within the last 12months improved approximately 2.5% during scal 2012. Sales from acquisitions in the last 12months favorably impacted sales by
0.7% for scal 2012. The changes in the exchange rates used to translate our foreign sales into U.S. dollars did not have a signi cant impacton sales
when compared to scal 2011.