Toyota 2015 Annual Report Download - page 161
Download and view the complete annual report
Please find page 161 of the 2015 Toyota annual report below. You can navigate through the pages in the report by either clicking on the pages listed below, or by using the keyword search tool below to find specific information within the annual report.-
 1
1 -
2
-
3
-
4
-
5
-
6
-
7
-
8
-
9
-
10
-
11
-
12
-
13
-
14
-
15
-
16
-
17
-
18
-
19
-
20
-
21
-
22
-
23
-
24
-
25
-
26
-
27
-
28
-
29
-
30
-
31
-
32
-
33
-
34
-
35
-
36
-
37
-
38
-
39
-
40
-
41
-
42
-
43
-
44
-
45
-
46
-
47
-
48
-
49
-
50
-
51
-
52
-
53
-
54
-
55
-
56
-
57
-
58
-
59
-
60
-
61
-
62
-
63
-
64
-
65
-
66
-
67
-
68
-
69
-
70
-
71
-
72
-
73
-
74
-
75
-
76
-
77
-
78
-
79
-
80
-
81
-
82
-
83
-
84
-
85
-
86
-
87
-
88
-
89
-
90
-
91
-
92
-
93
-
94
-
95
-
96
-
97
-
98
-
99
-
100
-
101
-
102
-
103
-
104
-
105
-
106
-
107
-
108
-
109
-
110
-
111
-
112
-
113
-
114
-
115
-
116
-
117
-
118
-
119
-
120
-
121
-
122
-
123
-
124
-
125
-
126
-
127
-
128
-
129
-
130
-
131
-
132
-
133
-
134
-
135
-
136
-
137
-
138
-
139
-
140
-
141
-
142
-
143
-
144
-
145
-
146
-
147
-
148
-
149
-
150
-
 151
151 -
 152
152 -
 153
153 -
 154
154 -
 155
155 -
 156
156 -
 157
157 -
 158
158 -
 159
159 -
 160
160 -
 161
161 -
 162
162 -
 163
163 -
 164
164 -
 165
165 -
 166
166 -
 167
167 -
 168
168 -
 169
169 -
 170
170 -
 171
171 -
172
-
173
-
174
-
175
-
176
-
177
-
178
-
179
-
180
-
181
-
182
-
183
-
184
-
185
-
186
-
187
-
188
-
189
-
190
-
191
-
192
-
193
-
194
-
195
-
196
-
197
-
198
-
199
-
200
-
201
-
202
-
203
-
204
-
205
-
206
-
207
-
208
-
209
-
210
-
211
-
212
-
213
-
214
-
215
-
216
-
217
-
218
-
219
-
220
-
221
-
222
-
223
-
224
-
225
-
226
-
227
-
228
 |
 |
TOYOTA MOTOR CORPORATION
NOTES TO CONSOLIDATED FINANCIAL STATEMENTS—(Continued)
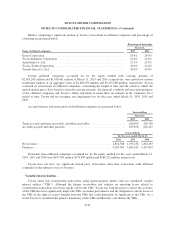
3. Supplemental cash flow information:
Cash payments for income taxes were ¥411,133 million, ¥1,145,808 million and ¥884,589 million for the
years ended March 31, 2014, 2015 and 2016, respectively. Interest payments during the years ended March 31,
2014, 2015 and 2016 were ¥352,590 million, ¥369,770 million and ¥381,280 million, respectively.
Capital lease obligations of ¥3,422 million, ¥3,709 million and ¥6,546 million were incurred for the years
ended March 31, 2014, 2015 and 2016, respectively.
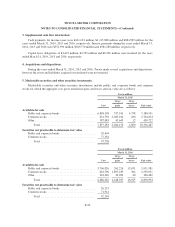
4. Acquisitions and dispositions:
During the years ended March 31, 2014, 2015 and 2016, Toyota made several acquisitions and dispositions,
however the assets and liabilities acquired or transferred were not material.
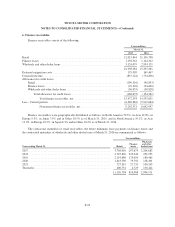
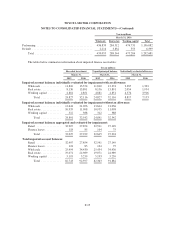
5. Marketable securities and other securities investments:
Marketable securities and other securities investments include public and corporate bonds and common
stocks for which the aggregate cost, gross unrealized gains and losses and fair value are as follows:
Yen in millions
March 31, 2015
Cost
Gross
unrealized
gains
Gross
unrealized
losses Fair value
Available-for-sale
Public and corporate bonds ........................ 6,848,348 337,341 4,738 7,180,951
Common stocks ................................. 621,750 2,083,164 100 2,704,814
Other .......................................... 387,085 43,649 12 430,722
Total ...................................... 7,857,183 2,464,154 4,850 10,316,487
Securities not practicable to determine fair value
Public and corporate bonds ........................ 20,404
Common stocks ................................. 77,334
Total ...................................... 97,738
Yen in millions
March 31, 2016
Cost
Gross
unrealized
gains
Gross
unrealized
losses Fair value
Available-for-sale
Public and corporate bonds ........................ 5,706,026 261,226 15,671 5,951,581
Common stocks ................................. 661,796 1,897,439 304 2,558,931
Other .......................................... 318,240 30,282 40 348,482
Total ...................................... 6,686,062 2,188,947 16,015 8,858,994
Securities not practicable to determine fair value
Public and corporate bonds ........................ 20,253
Common stocks ................................. 71,941
Total ...................................... 92,194
F-20