Toyota 2015 Annual Report Download - page 54
Download and view the complete annual report
Please find page 54 of the 2015 Toyota annual report below. You can navigate through the pages in the report by either clicking on the pages listed below, or by using the keyword search tool below to find specific information within the annual report.-
 1
1 -
2
-
3
-
4
-
5
-
6
-
7
-
8
-
9
-
10
-
11
-
12
-
13
-
14
-
15
-
16
-
17
-
18
-
19
-
20
-
21
-
22
-
23
-
24
-
25
-
26
-
27
-
28
-
29
-
30
-
31
-
32
-
33
-
34
-
35
-
36
-
37
-
38
-
39
-
40
-
41
-
42
-
43
-
 44
44 -
 45
45 -
 46
46 -
 47
47 -
 48
48 -
 49
49 -
 50
50 -
 51
51 -
 52
52 -
 53
53 -
 54
54 -
 55
55 -
 56
56 -
 57
57 -
 58
58 -
 59
59 -
 60
60 -
 61
61 -
 62
62 -
 63
63 -
 64
64 -
65
-
66
-
67
-
68
-
69
-
70
-
71
-
72
-
73
-
74
-
75
-
76
-
77
-
78
-
79
-
80
-
81
-
82
-
83
-
84
-
85
-
86
-
87
-
88
-
89
-
90
-
91
-
92
-
93
-
94
-
95
-
96
-
97
-
98
-
99
-
100
-
101
-
102
-
103
-
104
-
105
-
106
-
107
-
108
-
109
-
110
-
111
-
112
-
113
-
114
-
115
-
116
-
117
-
118
-
119
-
120
-
121
-
122
-
123
-
124
-
125
-
126
-
127
-
128
-
129
-
130
-
131
-
132
-
133
-
134
-
135
-
136
-
137
-
138
-
139
-
140
-
141
-
142
-
143
-
144
-
145
-
146
-
147
-
148
-
149
-
150
-
151
-
152
-
153
-
154
-
155
-
156
-
157
-
158
-
159
-
160
-
161
-
162
-
163
-
164
-
165
-
166
-
167
-
168
-
169
-
170
-
171
-
172
-
173
-
174
-
175
-
176
-
177
-
178
-
179
-
180
-
181
-
182
-
183
-
184
-
185
-
186
-
187
-
188
-
189
-
190
-
191
-
192
-
193
-
194
-
195
-
196
-
197
-
198
-
199
-
200
-
201
-
202
-
203
-
204
-
205
-
206
-
207
-
208
-
209
-
210
-
211
-
212
-
213
-
214
-
215
-
216
-
217
-
218
-
219
-
220
-
221
-
222
-
223
-
224
-
225
-
226
-
227
-
228
 |
 |

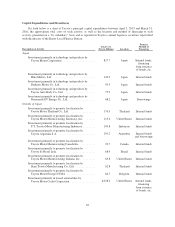
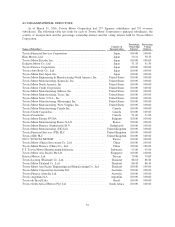
Capital Expenditures and Divestitures
Set forth below is a chart of Toyota’s principal capital expenditures between April 1, 2013 and March 31,
2016, the approximate total costs of such activity, as well as the location and method of financing of such
activity, presented on a “by subsidiary” basis and as reported in Toyota’s annual Japanese securities report filed
with the director of the Kanto Local Finance Bureau.
Description of Activity
Total Cost
(Yen in billions) Location
Primary
Method of
Financing
Japan
Investment primarily in technology and products by
Toyota Motor Corporation ...................... 827.7 Japan Internal funds,
financing
from issuance
of bonds, etc.
Investment primarily in technology and products by
Hino Motors, Ltd. ............................. 120.9 Japan Internal funds
Investment primarily in technology and products by
Daihatsu Motor Co., Ltd. ....................... 93.3 Japan Internal funds
Investment primarily in technology and products by
Toyota Auto Body Co., Ltd. ..................... 75.9 Japan Internal funds
Investment primarily in technology and products by
Primeearth EV Energy Co., Ltd. .................. 68.2 Japan Borrowings
Outside of Japan
Investment primarily to promote localization by
Toyota Motor Thailand Co., Ltd. ................. 176.5 Thailand Internal funds
Investment primarily to promote localization by
Toyota Motor Manufacturing, Kentucky, Inc. ....... 115.4 United States Internal funds
Investment primarily to promote localization by
P.T. Toyota Motor Manufacturing Indonesia ........ 105.8 Indonesia Internal funds
Investment primarily to promote localization by
Toyota Argentina S.A. ......................... 101.2 Argentina Internal funds
and borrowings
Investment primarily to promote localization by
Toyota Motor Manufacturing Canada Inc. .......... 99.7 Canada Internal funds
Investment primarily to promote localization by
Toyota do Brasil Ltda. ......................... 68.9 Brazil Internal funds
Investment primarily to promote localization by
Toyota Motor Manufacturing, Indiana, Inc. ......... 65.8 United States Internal funds
Investment primarily to promote localization by
Siam Toyota Manufacturing Co., Ltd. ............. 62.8 Thailand Internal funds
Investment primarily to promote localization by
Toyota Motor Europe NV/SA .................... 62.7 Belgium Internal funds
Investment primarily in leased automobiles by
Toyota Motor Credit Corporation ................. 6,028.2 United States Internal funds,
financing
from issuance
of bonds, etc.
49