Toyota 2015 Annual Report Download - page 213
Download and view the complete annual report
Please find page 213 of the 2015 Toyota annual report below. You can navigate through the pages in the report by either clicking on the pages listed below, or by using the keyword search tool below to find specific information within the annual report.-
 1
1 -
2
-
3
-
4
-
5
-
6
-
7
-
8
-
9
-
10
-
11
-
12
-
13
-
14
-
15
-
16
-
17
-
18
-
19
-
20
-
21
-
22
-
23
-
24
-
25
-
26
-
27
-
28
-
29
-
30
-
31
-
32
-
33
-
34
-
35
-
36
-
37
-
38
-
39
-
40
-
41
-
42
-
43
-
44
-
45
-
46
-
47
-
48
-
49
-
50
-
51
-
52
-
53
-
54
-
55
-
56
-
57
-
58
-
59
-
60
-
61
-
62
-
63
-
64
-
65
-
66
-
67
-
68
-
69
-
70
-
71
-
72
-
73
-
74
-
75
-
76
-
77
-
78
-
79
-
80
-
81
-
82
-
83
-
84
-
85
-
86
-
87
-
88
-
89
-
90
-
91
-
92
-
93
-
94
-
95
-
96
-
97
-
98
-
99
-
100
-
101
-
102
-
103
-
104
-
105
-
106
-
107
-
108
-
109
-
110
-
111
-
112
-
113
-
114
-
115
-
116
-
117
-
118
-
119
-
120
-
121
-
122
-
123
-
124
-
125
-
126
-
127
-
128
-
129
-
130
-
131
-
132
-
133
-
134
-
135
-
136
-
137
-
138
-
139
-
140
-
141
-
142
-
143
-
144
-
145
-
146
-
147
-
148
-
149
-
150
-
151
-
152
-
153
-
154
-
155
-
156
-
157
-
158
-
159
-
160
-
161
-
162
-
163
-
164
-
165
-
166
-
167
-
168
-
169
-
170
-
171
-
172
-
173
-
174
-
175
-
176
-
177
-
178
-
179
-
180
-
181
-
182
-
183
-
184
-
185
-
186
-
187
-
188
-
189
-
190
-
191
-
192
-
193
-
194
-
195
-
196
-
197
-
198
-
199
-
200
-
201
-
202
-
 203
203 -
 204
204 -
 205
205 -
 206
206 -
 207
207 -
 208
208 -
 209
209 -
 210
210 -
 211
211 -
 212
212 -
 213
213 -
 214
214 -
 215
215 -
 216
216 -
 217
217 -
 218
218 -
 219
219 -
 220
220 -
 221
221 -
 222
222 -
 223
223 -
224
-
225
-
226
-
227
-
228
 |
 |
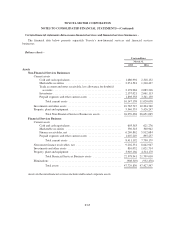
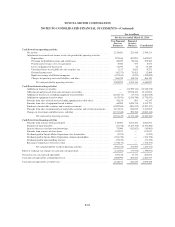
TOYOTA MOTOR CORPORATION
NOTES TO CONSOLIDATED FINANCIAL STATEMENTS—(Continued)
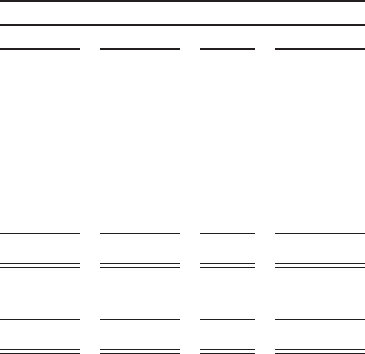
Yen in millions
March 31, 2016
Level 1 Level 2 Level 3 Total
Assets
Cash equivalents ................................... 100,841 915,684 — 1,016,525
Time deposits ..................................... — 600,000 — 600,000
Marketable securities and other securities investments
Public and corporate bonds ...................... 4,911,769 1,029,478 10,334 5,951,581
Common stocks ............................... 2,558,931 — — 2,558,931
Other ........................................ 83,082 265,400 — 348,482
Derivative financial instruments ...................... — 362,388 4,423 366,811
Total .................................... 7,654,623 3,172,950 14,757 10,842,330
Liabilities
Derivative financial instruments ...................... — (242,713) (1,574) (244,287)
Total .................................... — (242,713) (1,574) (244,287)
The following is description of the assets and liabilities measured at fair value, information about the
valuation techniques used to measure fair value, key inputs and significant assumptions:
Cash equivalents and time deposits -
Cash equivalents include money market funds and other investments with original maturities of three
months or less. Cash equivalents classified in Level 2 include negotiable certificate of deposit with original
maturities of three months or less. These are measured at fair value using primarily observable interest rates in
the market. Time deposits consist of negotiable certificates of deposit with original maturities over three months.
These are measured at fair value using primarily observable interest rates in the market.
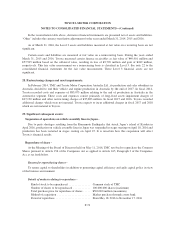
Marketable securities and other securities investments -
Marketable securities and other securities investments include public and corporate bonds, common stocks
and other investments. Public and corporate bonds include government bonds and represent 43% of Japanese
bonds, and 57% of U.S., European and other bonds as of March 31, 2015, and 37% of Japanese bonds, and 63%
of U.S., European and other bonds as of March 31, 2016. Listed stocks on the Japanese stock markets represent
88% and 90% of common stocks as of March 31, 2015 and 2016, respectively. Toyota uses primarily quoted
market prices for identical assets to measure fair value of these securities. “Other” includes investment trusts.
Generally, Toyota uses quoted market prices for similar assets or quoted non-active market prices for identical
assets to measure fair value of these securities. These assets are classified in Level 2.
Derivative financial instruments -
See note 21 to the consolidated financial statements about derivative financial instruments. Toyota primarily
estimates the fair value of derivative financial instruments using industry-standard valuation models that require
observable inputs including interest rates and foreign exchange rates, and the contractual terms. The usage of
these models does not require significant judgment to be applied. These derivative financial instruments are
classified in Level 2. In other certain cases when market data is not available, key inputs to the fair value
measurement include quotes from counterparties, and other market data. Toyota assesses the reasonableness of
changes of the quotes using observable market data. These derivative financial instruments are classified in
Level 3. Toyota’s derivative fair value measurements consider assumptions about counterparty and Toyota’s own
non-performance risk, using such as credit default probabilities.
F-72