Toyota 2015 Annual Report Download - page 209
Download and view the complete annual report
Please find page 209 of the 2015 Toyota annual report below. You can navigate through the pages in the report by either clicking on the pages listed below, or by using the keyword search tool below to find specific information within the annual report.-
 1
1 -
2
-
3
-
4
-
5
-
6
-
7
-
8
-
9
-
10
-
11
-
12
-
13
-
14
-
15
-
16
-
17
-
18
-
19
-
20
-
21
-
22
-
23
-
24
-
25
-
26
-
27
-
28
-
29
-
30
-
31
-
32
-
33
-
34
-
35
-
36
-
37
-
38
-
39
-
40
-
41
-
42
-
43
-
44
-
45
-
46
-
47
-
48
-
49
-
50
-
51
-
52
-
53
-
54
-
55
-
56
-
57
-
58
-
59
-
60
-
61
-
62
-
63
-
64
-
65
-
66
-
67
-
68
-
69
-
70
-
71
-
72
-
73
-
74
-
75
-
76
-
77
-
78
-
79
-
80
-
81
-
82
-
83
-
84
-
85
-
86
-
87
-
88
-
89
-
90
-
91
-
92
-
93
-
94
-
95
-
96
-
97
-
98
-
99
-
100
-
101
-
102
-
103
-
104
-
105
-
106
-
107
-
108
-
109
-
110
-
111
-
112
-
113
-
114
-
115
-
116
-
117
-
118
-
119
-
120
-
121
-
122
-
123
-
124
-
125
-
126
-
127
-
128
-
129
-
130
-
131
-
132
-
133
-
134
-
135
-
136
-
137
-
138
-
139
-
140
-
141
-
142
-
143
-
144
-
145
-
146
-
147
-
148
-
149
-
150
-
151
-
152
-
153
-
154
-
155
-
156
-
157
-
158
-
159
-
160
-
161
-
162
-
163
-
164
-
165
-
166
-
167
-
168
-
169
-
170
-
171
-
172
-
173
-
174
-
175
-
176
-
177
-
178
-
179
-
180
-
181
-
182
-
183
-
184
-
185
-
186
-
187
-
188
-
189
-
190
-
191
-
192
-
193
-
194
-
195
-
196
-
197
-
198
-
 199
199 -
 200
200 -
 201
201 -
 202
202 -
 203
203 -
 204
204 -
 205
205 -
 206
206 -
 207
207 -
 208
208 -
 209
209 -
 210
210 -
 211
211 -
 212
212 -
 213
213 -
 214
214 -
 215
215 -
 216
216 -
 217
217 -
 218
218 -
 219
219 -
220
-
221
-
222
-
223
-
224
-
225
-
226
-
227
-
228
 |
 |

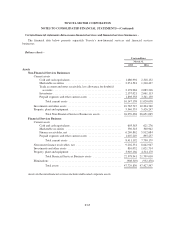
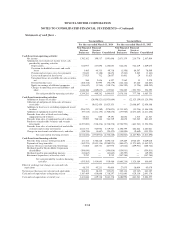
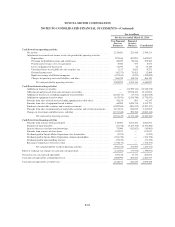
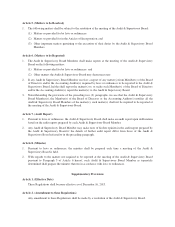
TOYOTA MOTOR CORPORATION
NOTES TO CONSOLIDATED FINANCIAL STATEMENTS—(Continued)
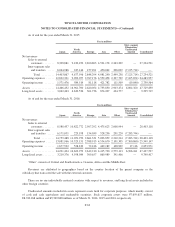
Statements of cash flows -
Yen in millions Yen in millions
For the year ended March 31, 2014 For the year ended March 31, 2015
Non-Financial
Services
Businesses
Financial
Services
Business Consolidated
Non-Financial
Services
Businesses
Financial
Services
Business Consolidated
Cash flows from operating activities
Net income .................................. 1,792,162 199,517 1,991,648 2,071,179 236,770 2,307,904
Adjustments to reconcile net income to net cash
provided by operating activities
Depreciation ............................. 812,957 437,896 1,250,853 844,456 564,619 1,409,075
Provision for doubtful accounts and credit
losses ................................ 3,405 46,313 49,718 (1,598) 80,567 78,969
Pension and severance costs, less payments .... 21,842 (1,188) 20,654 (5,263) 2,102 (3,161)
Losses on disposal of fixed assets ............ 27,925 732 28,657 31,601 24 31,625
Unrealized losses on available-for-sale securities,
net................................... 560 5,636 6,197 2,565 13 2,578
Deferred income taxes ..................... (108,318) 51,995 (56,279) (114,122) 87,260 (26,887)
Equity in earnings of affiliated companies ..... (316,612) (1,764) (318,376) (306,749) (1,796) (308,545)
Changes in operating assets and liabilities, and
other ................................. 1,010,360 (269,875) 672,963 356,269 (191,791) 194,195
Net cash provided by operating activities . . 3,244,281 469,262 3,646,035 2,878,338 777,768 3,685,753
Cash flows from investing activities
Additions to finance receivables ................. — (20,598,521)(11,953,064) — (22,325,159)(13,126,596)
Collection of and proceeds from sales of finance
receivables ................................ — 19,612,456 11,025,353 — 21,668,847 12,450,388
Additions to fixed assets excluding equipment leased
to others .................................. (956,232) (13,789) (970,021) (1,133,102) (13,216) (1,146,318)
Additions to equipment leased to others ........... (97,515) (1,611,155) (1,708,670) (137,985) (2,073,265) (2,211,250)
Proceeds from sales of fixed assets excluding
equipment leased to others .................... 38,311 880 39,191 40,032 1,515 41,547
Proceeds from sales of equipment leased to others . . . 35,995 708,344 744,339 40,878 762,545 803,423
Purchases of marketable securities and security
investments ............................... (4,227,802) (510,476) (4,738,278) (2,530,591) (663,703) (3,194,294)
Proceeds from sales of and maturity of marketable
securities and security investments ............. 2,813,373 505,954 3,319,327 2,198,799 484,202 2,683,001
Changes in investments and other assets, and other . . (118,750) (4,607) (94,425) (114,094) (9,669) (113,391)
Net cash used in investing activities ...... (2,512,620) (1,910,914) (4,336,248) (1,636,063) (2,167,903) (3,813,490)
Cash flows from financing activities
Proceeds from issuance of long-term debt .......... 121,723 3,780,228 3,890,310 119,449 4,960,157 5,029,018
Payments of long-term debt ..................... (169,233) (2,831,116) (2,988,923) (100,627) (3,373,842) (3,462,237)
Increase (decrease) in short-term borrowings ....... 21,808 465,731 467,976 (47,026) (259,931) (288,724)
Dividends paid to Toyota Motor Corporation
shareholders ............................... (396,030) — (396,030) (554,933) — (554,933)
Dividends paid to noncontrolling interests ......... (63,065) — (63,065) (69,295) — (69,295)
Reissuance (repurchase) of treasury stock .......... 9,212 — 9,212 (347,784) — (347,784)
Net cash provided by (used in) financing
activities .......................... (475,585) 1,414,843 919,480 (1,000,216) 1,326,384 306,045
Effect of exchange rate changes on cash and cash
equivalents .................................... 48,375 45,231 93,606 27,075 38,004 65,079
Net increase (decrease) in cash and cash equivalents ..... 304,451 18,422 322,873 269,134 (25,747) 243,387
Cash and cash equivalents at beginning of year ......... 1,107,409 610,888 1,718,297 1,411,860 629,310 2,041,170
Cash and cash equivalents at end of year ............... 1,411,860 629,310 2,041,170 1,680,994 603,563 2,284,557
F-68