Toyota 2015 Annual Report Download - page 163
Download and view the complete annual report
Please find page 163 of the 2015 Toyota annual report below. You can navigate through the pages in the report by either clicking on the pages listed below, or by using the keyword search tool below to find specific information within the annual report.-
 1
1 -
2
-
3
-
4
-
5
-
6
-
7
-
8
-
9
-
10
-
11
-
12
-
13
-
14
-
15
-
16
-
17
-
18
-
19
-
20
-
21
-
22
-
23
-
24
-
25
-
26
-
27
-
28
-
29
-
30
-
31
-
32
-
33
-
34
-
35
-
36
-
37
-
38
-
39
-
40
-
41
-
42
-
43
-
44
-
45
-
46
-
47
-
48
-
49
-
50
-
51
-
52
-
53
-
54
-
55
-
56
-
57
-
58
-
59
-
60
-
61
-
62
-
63
-
64
-
65
-
66
-
67
-
68
-
69
-
70
-
71
-
72
-
73
-
74
-
75
-
76
-
77
-
78
-
79
-
80
-
81
-
82
-
83
-
84
-
85
-
86
-
87
-
88
-
89
-
90
-
91
-
92
-
93
-
94
-
95
-
96
-
97
-
98
-
99
-
100
-
101
-
102
-
103
-
104
-
105
-
106
-
107
-
108
-
109
-
110
-
111
-
112
-
113
-
114
-
115
-
116
-
117
-
118
-
119
-
120
-
121
-
122
-
123
-
124
-
125
-
126
-
127
-
128
-
129
-
130
-
131
-
132
-
133
-
134
-
135
-
136
-
137
-
138
-
139
-
140
-
141
-
142
-
143
-
144
-
145
-
146
-
147
-
148
-
149
-
150
-
151
-
152
-
 153
153 -
 154
154 -
 155
155 -
 156
156 -
 157
157 -
 158
158 -
 159
159 -
 160
160 -
 161
161 -
 162
162 -
 163
163 -
 164
164 -
 165
165 -
 166
166 -
 167
167 -
 168
168 -
 169
169 -
 170
170 -
 171
171 -
 172
172 -
 173
173 -
174
-
175
-
176
-
177
-
178
-
179
-
180
-
181
-
182
-
183
-
184
-
185
-
186
-
187
-
188
-
189
-
190
-
191
-
192
-
193
-
194
-
195
-
196
-
197
-
198
-
199
-
200
-
201
-
202
-
203
-
204
-
205
-
206
-
207
-
208
-
209
-
210
-
211
-
212
-
213
-
214
-
215
-
216
-
217
-
218
-
219
-
220
-
221
-
222
-
223
-
224
-
225
-
226
-
227
-
228
 |
 |

TOYOTA MOTOR CORPORATION
NOTES TO CONSOLIDATED FINANCIAL STATEMENTS—(Continued)
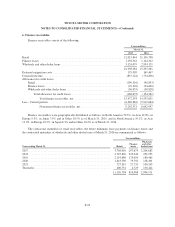
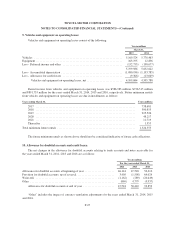
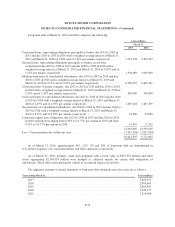
6. Finance receivables:
Finance receivables consist of the following:
Yen in millions
March 31,
2015 2016
Retail ................................................................ 12,015,844 11,156,798
Finance leases ......................................................... 1,158,361 1,144,312
Wholesale and other dealer loans .......................................... 3,124,079 2,994,171
16,298,284 15,295,281
Deferred origination costs ................................................ 179,905 169,467
Unearned income ....................................................... (837,124) (754,836)
Allowance for credit losses
Retail ............................................................ (109,316) (98,853)
Finance leases ..................................................... (29,303) (24,600)
Wholesale and other dealer loans ...................................... (30,053) (30,828)
Total allowance for credit losses ................................... (168,672) (154,281)
Total finance receivables, net ................................. 15,472,393 14,555,631
Less - Current portion ................................................... (6,269,862) (5,912,684)
Noncurrent finance receivables, net ............................ 9,202,531 8,642,947
Finance receivables were geographically distributed as follows: in North America 59.3%, in Asia 12.8%, in
Europe 9.5%, in Japan 7.9% and in Other 10.5% as of March 31, 2015, and in North America 59.1%, in Asia
11.9%, in Europe 10.3%, in Japan 8.3% and in Other 10.4% as of March 31, 2016.
The contractual maturities of retail receivables, the future minimum lease payments on finance leases and
the contractual maturities of wholesale and other dealer loans at March 31, 2016 are summarized as follows:
Yen in millions
Years ending March 31, Retail
Finance
leases
Wholesale
and other
dealer loans
2017 ......................................................... 3,708,910 297,674 2,204,683
2018 ......................................................... 2,745,820 225,249 259,953
2019 ......................................................... 2,154,888 175,003 180,465
2020 ......................................................... 1,418,530 79,702 118,401
2021 ......................................................... 727,919 27,731 100,245
Thereafter ..................................................... 400,731 4,729 130,424
11,156,798 810,088 2,994,171
F-22