Toyota 2015 Annual Report Download - page 88
Download and view the complete annual report
Please find page 88 of the 2015 Toyota annual report below. You can navigate through the pages in the report by either clicking on the pages listed below, or by using the keyword search tool below to find specific information within the annual report.-
 1
1 -
2
-
3
-
4
-
5
-
6
-
7
-
8
-
9
-
10
-
11
-
12
-
13
-
14
-
15
-
16
-
17
-
18
-
19
-
20
-
21
-
22
-
23
-
24
-
25
-
26
-
27
-
28
-
29
-
30
-
31
-
32
-
33
-
34
-
35
-
36
-
37
-
38
-
39
-
40
-
41
-
42
-
43
-
44
-
45
-
46
-
47
-
48
-
49
-
50
-
51
-
52
-
53
-
54
-
55
-
56
-
57
-
58
-
59
-
60
-
61
-
62
-
63
-
64
-
65
-
66
-
67
-
68
-
69
-
70
-
71
-
72
-
73
-
74
-
75
-
76
-
77
-
 78
78 -
 79
79 -
 80
80 -
 81
81 -
 82
82 -
 83
83 -
 84
84 -
 85
85 -
 86
86 -
 87
87 -
 88
88 -
 89
89 -
 90
90 -
 91
91 -
 92
92 -
 93
93 -
 94
94 -
 95
95 -
 96
96 -
 97
97 -
 98
98 -
99
-
100
-
101
-
102
-
103
-
104
-
105
-
106
-
107
-
108
-
109
-
110
-
111
-
112
-
113
-
114
-
115
-
116
-
117
-
118
-
119
-
120
-
121
-
122
-
123
-
124
-
125
-
126
-
127
-
128
-
129
-
130
-
131
-
132
-
133
-
134
-
135
-
136
-
137
-
138
-
139
-
140
-
141
-
142
-
143
-
144
-
145
-
146
-
147
-
148
-
149
-
150
-
151
-
152
-
153
-
154
-
155
-
156
-
157
-
158
-
159
-
160
-
161
-
162
-
163
-
164
-
165
-
166
-
167
-
168
-
169
-
170
-
171
-
172
-
173
-
174
-
175
-
176
-
177
-
178
-
179
-
180
-
181
-
182
-
183
-
184
-
185
-
186
-
187
-
188
-
189
-
190
-
191
-
192
-
193
-
194
-
195
-
196
-
197
-
198
-
199
-
200
-
201
-
202
-
203
-
204
-
205
-
206
-
207
-
208
-
209
-
210
-
211
-
212
-
213
-
214
-
215
-
216
-
217
-
218
-
219
-
220
-
221
-
222
-
223
-
224
-
225
-
226
-
227
-
228
 |
 |

Allowance for Doubtful Accounts and Credit Losses
Natures of estimates and assumptions
Retail receivables and finance lease receivables consist of retail installment sales contracts secured by
passenger cars and commercial vehicles. Collectability risks include consumer and dealer insolvencies and
insufficient collateral values (less costs to sell) to realize the full carrying values of these receivables. As a matter
of policy, Toyota maintains an allowance for doubtful accounts and credit losses representing management’s
estimate of the amount of asset impairment in the portfolios of finance, trade and other receivables. Toyota
determines the allowance for doubtful accounts and credit losses based on a systematic, ongoing review and
evaluation performed as part of the credit-risk evaluation process, historical loss experience, the size and
composition of the portfolios, current economic events and conditions, the estimated fair value and adequacy of
collateral, and other pertinent factors. This evaluation is inherently judgmental and requires material estimates,
including the amounts and timing of future cash flows expected to be received, which may be susceptible to
significant change. Although management considers the allowance for doubtful accounts and credit losses to be
adequate based on information currently available, additional provisions may be necessary due to (i) changes in
management estimates and assumptions about asset impairments, (ii) information that indicates changes in
expected future cash flows, or (iii) changes in economic and other events and conditions. To the extent that sales
incentives remain an integral part of sales promotion with the effect of reducing new vehicle prices, resale prices
of used vehicles and, correspondingly, the collateral value of Toyota’s retail receivables and finance lease
receivables could experience further downward pressure. If these factors require a significant increase in
Toyota’s allowance for doubtful accounts and credit losses, it could negatively affect future operating results of
the financial services operations. The level of credit losses, which has a greater impact on Toyota’s results of
operations, is influenced by two factors: frequency of occurrence and expected severity of loss. For evaluation
purposes, exposures to credit losses are segmented into the two primary categories of “consumer” and “dealer”.
Toyota’s “consumer” category consists of smaller balances that are homogenous retail receivables and finance
lease receivables. The “dealer” category consists of wholesale and other dealer loan receivables. The overall
allowance for credit losses is evaluated at least quarterly, considering a variety of assumptions and factors to
determine whether reserves are considered adequate to cover probable losses.
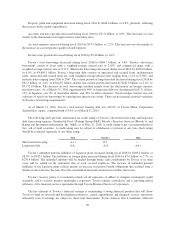
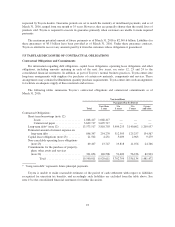
Sensitivity analysis
The level of credit losses, which could significantly impact Toyota’s results of operations, is influenced by
two factors: frequency of occurrence and expected severity of loss. The overall allowance for credit losses is
evaluated at least quarterly, considering a variety of assumptions and factors to determine whether reserves are
considered adequate to cover probable losses. The following table illustrates the effect of an assumed change in
frequency of occurrence or expected severity of loss mainly in the United States, assuming all other assumptions
are held consistent. The table below represents the impact on the allowance for credit losses in Toyota’s financial
services operations of the change in frequency of occurrence or expected severity of loss as any change impacts
most significantly on the financial services operations.
Yen in millions
Effect on the allowance
for credit losses
as of March 31, 2016
10 percent change in frequency of occurrence or expected severity of loss .............. 4,507
Investment in Operating Leases
Natures of estimates and assumptions
Vehicles on operating leases, where Toyota is the lessor, are valued at cost and depreciated over their
estimated useful lives using the straight-line method to their estimated residual values. Toyota utilizes industry
published information and its own historical experience to determine estimated residual values for these vehicles.
83