Toyota 2015 Annual Report Download - page 74
Download and view the complete annual report
Please find page 74 of the 2015 Toyota annual report below. You can navigate through the pages in the report by either clicking on the pages listed below, or by using the keyword search tool below to find specific information within the annual report.-
 1
1 -
2
-
3
-
4
-
5
-
6
-
7
-
8
-
9
-
10
-
11
-
12
-
13
-
14
-
15
-
16
-
17
-
18
-
19
-
20
-
21
-
22
-
23
-
24
-
25
-
26
-
27
-
28
-
29
-
30
-
31
-
32
-
33
-
34
-
35
-
36
-
37
-
38
-
39
-
40
-
41
-
42
-
43
-
44
-
45
-
46
-
47
-
48
-
49
-
50
-
51
-
52
-
53
-
54
-
55
-
56
-
57
-
58
-
59
-
60
-
61
-
62
-
63
-
 64
64 -
 65
65 -
 66
66 -
 67
67 -
 68
68 -
 69
69 -
 70
70 -
 71
71 -
 72
72 -
 73
73 -
 74
74 -
 75
75 -
 76
76 -
 77
77 -
 78
78 -
 79
79 -
 80
80 -
 81
81 -
 82
82 -
 83
83 -
 84
84 -
85
-
86
-
87
-
88
-
89
-
90
-
91
-
92
-
93
-
94
-
95
-
96
-
97
-
98
-
99
-
100
-
101
-
102
-
103
-
104
-
105
-
106
-
107
-
108
-
109
-
110
-
111
-
112
-
113
-
114
-
115
-
116
-
117
-
118
-
119
-
120
-
121
-
122
-
123
-
124
-
125
-
126
-
127
-
128
-
129
-
130
-
131
-
132
-
133
-
134
-
135
-
136
-
137
-
138
-
139
-
140
-
141
-
142
-
143
-
144
-
145
-
146
-
147
-
148
-
149
-
150
-
151
-
152
-
153
-
154
-
155
-
156
-
157
-
158
-
159
-
160
-
161
-
162
-
163
-
164
-
165
-
166
-
167
-
168
-
169
-
170
-
171
-
172
-
173
-
174
-
175
-
176
-
177
-
178
-
179
-
180
-
181
-
182
-
183
-
184
-
185
-
186
-
187
-
188
-
189
-
190
-
191
-
192
-
193
-
194
-
195
-
196
-
197
-
198
-
199
-
200
-
201
-
202
-
203
-
204
-
205
-
206
-
207
-
208
-
209
-
210
-
211
-
212
-
213
-
214
-
215
-
216
-
217
-
218
-
219
-
220
-
221
-
222
-
223
-
224
-
225
-
226
-
227
-
228
 |
 |
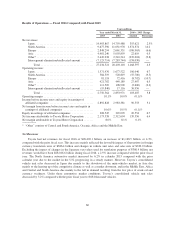
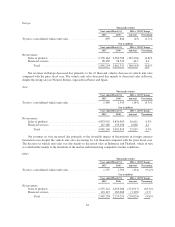
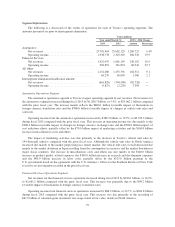
Automotive Operations Segment
The automotive operations segment is Toyota’s largest operating segment by net revenues. Net revenues for
the automotive segment increased during fiscal 2016 by ¥915.2 billion, or 3.7%, to ¥25,977.4 billion compared
with the prior fiscal year. The increase mainly reflects the ¥330.0 billion favorable impact of changes in vehicle
unit sales and sales mix and the ¥307.5 billion favorable impact of fluctuations in foreign currency translation
rates.
Operating income from the automotive operations increased by ¥123.6 billion, or 5.3%, to ¥2,448.9 billion
during fiscal 2016 compared with the prior fiscal year. This increase in operating income was due mainly to the
¥390.0 billion impact of cost reduction efforts and the ¥160.0 billion favorable impact of changes in foreign
currency exchange rates, partially offset by the ¥110.0 billion impact of marketing activities and the
¥340.0 billion increase in miscellaneous costs and others.
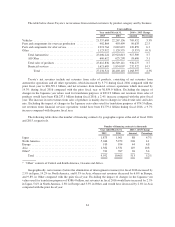
The impact of marketing activities was due primarily to the decrease in Toyota’s vehicle unit sales by
291 thousand vehicles compared with the prior fiscal year. The vehicle unit sales decreased due mainly to the
slowdown of the mini-vehicles market in Japan, the heating up of the competitive climate, as well as the market
downturn, in Asia, the fall in demand resulting from the low price of crude oil and currency weakness in the
Middle East, Africa, and Central and South America despite the increase in sales in the steady North American
market. The increase in miscellaneous costs and others was due mainly to the ¥110.0 billion increase in labor
costs, the ¥50.0 billion increase in research and development expenses, the ¥50.0 billion increase in depreciation
expenses and the ¥110.0 billion increase in other various costs.
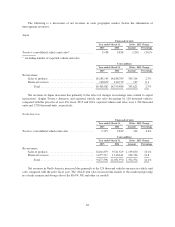
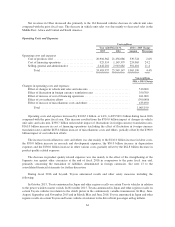
Financial Services Operations Segment
Net revenues for the financial services operations increased during fiscal 2016 by ¥235.0 billion, or 14.2%,
to ¥1,896.2 billion compared with the prior fiscal year. This increase was primarily due to the ¥74.8 billion
favorable impact of fluctuations in foreign currency translation rates.
Operating income from financial services operations decreased by ¥22.6 billion, or 6.2%, to ¥339.2 billion
during fiscal 2016 compared with the prior fiscal year. This decrease was due primarily to a ¥19.7 billion
worsening overall of valuation gains or losses on interest rate swaps stated at fair value, mainly in North
America.
All Other Operations Segment
Net revenues for Toyota’s other operations segments decreased by ¥78.4 billion, or 6.2%, to ¥1,177.3 billion
during fiscal 2016 compared with the prior fiscal year.
Operating income from Toyota’s other operations segments increased by ¥0.8 billion, or 1.3%, to
¥66.5 billion during fiscal 2016 compared with the prior fiscal year.
69