Toyota 2015 Annual Report Download - page 65
Download and view the complete annual report
Please find page 65 of the 2015 Toyota annual report below. You can navigate through the pages in the report by either clicking on the pages listed below, or by using the keyword search tool below to find specific information within the annual report.-
 1
1 -
2
-
3
-
4
-
5
-
6
-
7
-
8
-
9
-
10
-
11
-
12
-
13
-
14
-
15
-
16
-
17
-
18
-
19
-
20
-
21
-
22
-
23
-
24
-
25
-
26
-
27
-
28
-
29
-
30
-
31
-
32
-
33
-
34
-
35
-
36
-
37
-
38
-
39
-
40
-
41
-
42
-
43
-
44
-
45
-
46
-
47
-
48
-
49
-
50
-
51
-
52
-
53
-
54
-
 55
55 -
 56
56 -
 57
57 -
 58
58 -
 59
59 -
 60
60 -
 61
61 -
 62
62 -
 63
63 -
 64
64 -
 65
65 -
 66
66 -
 67
67 -
 68
68 -
 69
69 -
 70
70 -
 71
71 -
 72
72 -
 73
73 -
 74
74 -
 75
75 -
76
-
77
-
78
-
79
-
80
-
81
-
82
-
83
-
84
-
85
-
86
-
87
-
88
-
89
-
90
-
91
-
92
-
93
-
94
-
95
-
96
-
97
-
98
-
99
-
100
-
101
-
102
-
103
-
104
-
105
-
106
-
107
-
108
-
109
-
110
-
111
-
112
-
113
-
114
-
115
-
116
-
117
-
118
-
119
-
120
-
121
-
122
-
123
-
124
-
125
-
126
-
127
-
128
-
129
-
130
-
131
-
132
-
133
-
134
-
135
-
136
-
137
-
138
-
139
-
140
-
141
-
142
-
143
-
144
-
145
-
146
-
147
-
148
-
149
-
150
-
151
-
152
-
153
-
154
-
155
-
156
-
157
-
158
-
159
-
160
-
161
-
162
-
163
-
164
-
165
-
166
-
167
-
168
-
169
-
170
-
171
-
172
-
173
-
174
-
175
-
176
-
177
-
178
-
179
-
180
-
181
-
182
-
183
-
184
-
185
-
186
-
187
-
188
-
189
-
190
-
191
-
192
-
193
-
194
-
195
-
196
-
197
-
198
-
199
-
200
-
201
-
202
-
203
-
204
-
205
-
206
-
207
-
208
-
209
-
210
-
211
-
212
-
213
-
214
-
215
-
216
-
217
-
218
-
219
-
220
-
221
-
222
-
223
-
224
-
225
-
226
-
227
-
228
 |
 |

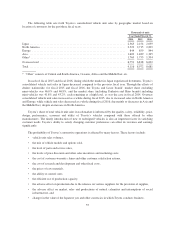
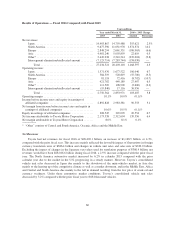
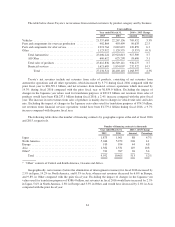
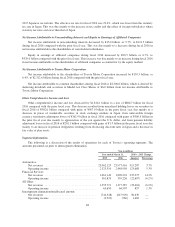
Results of Operations — Fiscal 2016 Compared with Fiscal 2015
Yen in millions
Year ended March 31, 2016 v. 2015 Change
2015 2016 Amount Percentage
Net revenues:
Japan ......................................... 14,403,867 14,759,488 355,621 2.5%
North America ................................. 9,677,596 11,051,970 1,374,374 14.2
Europe ....................................... 2,848,294 2,661,331 (186,963) (6.6)
Asia ......................................... 4,981,240 5,003,859 22,619 0.5
Other* ........................................ 2,449,238 2,210,214 (239,024) (9.8)
Intersegment elimination/unallocated amount ......... (7,125,714) (7,283,744) (158,030) —
Total ..................................... 27,234,521 28,403,118 1,168,597 4.3
Operating income:
Japan ......................................... 1,571,476 1,677,522 106,046 6.7
North America ................................. 584,519 528,819 (55,700) (9.5)
Europe ....................................... 81,118 72,416 (8,702) (10.7)
Asia ......................................... 421,782 449,189 27,407 6.5
Other* ........................................ 111,509 108,909 (2,600) (2.3)
Intersegment elimination/unallocated amount ......... (19,840) 17,116 36,956 —
Total ..................................... 2,750,564 2,853,971 103,407 3.8
Operating margin ................................... 10.1% 10.0% (0.1)%
Income before income taxes and equity in earnings of
affiliated companies ............................... 2,892,828 2,983,381 90,553 3.1
Net margin from income before income taxes and equity in
earnings of affiliated companies ..................... 10.6% 10.5% (0.1)%
Equity in earnings of affiliated companies ............... 308,545 329,099 20,554 6.7
Net income attributable to Toyota Motor Corporation ...... 2,173,338 2,312,694 139,356 6.4
Net margin attributable to Toyota Motor Corporation ....... 8.0% 8.1% 0.1%
* “Other” consists of Central and South America, Oceania, Africa and the Middle East.
Net Revenues
Toyota had net revenues for fiscal 2016 of ¥28,403.1 billion, an increase of ¥1,168.5 billion, or 4.3%,
compared with the prior fiscal year. This increase mainly reflected the favorable impact of fluctuations in foreign
currency translation rates of ¥386.4 billion and changes in vehicle unit sales and sales mix of ¥330.0 billion.
Excluding the impact of changes in the Japanese yen values used for translation purposes of ¥386.4 billion, net
revenues would have been ¥28,016.6 billion during fiscal 2016, a 2.9% increase compared with the prior fiscal
year. The North America automotive market increased by 6.2% in calendar 2015 compared with the prior
calendar year due to the market in the U.S. progressing in a steady manner. However, Toyota’s consolidated
vehicle unit sales decreased in Japan due mainly to the slowdown of the mini-vehicles market, in Asia due
mainly to the heating up of the competitive climate as well as a market downturn, and in the Middle East, Africa
and Central and South America due mainly to the fall in demand resulting from the low price of crude oil and
currency weakness. Under these automotive market conditions, Toyota’s consolidated vehicle unit sales
decreased by 3.2% compared with the prior fiscal year to 8,681 thousand vehicles.
60