Toyota 2015 Annual Report Download - page 28
Download and view the complete annual report
Please find page 28 of the 2015 Toyota annual report below. You can navigate through the pages in the report by either clicking on the pages listed below, or by using the keyword search tool below to find specific information within the annual report.-
 1
1 -
2
-
3
-
4
-
5
-
6
-
7
-
8
-
9
-
10
-
11
-
12
-
13
-
14
-
15
-
16
-
17
-
 18
18 -
 19
19 -
 20
20 -
 21
21 -
 22
22 -
 23
23 -
 24
24 -
 25
25 -
 26
26 -
 27
27 -
 28
28 -
 29
29 -
 30
30 -
 31
31 -
 32
32 -
 33
33 -
 34
34 -
 35
35 -
 36
36 -
 37
37 -
 38
38 -
39
-
40
-
41
-
42
-
43
-
44
-
45
-
46
-
47
-
48
-
49
-
50
-
51
-
52
-
53
-
54
-
55
-
56
-
57
-
58
-
59
-
60
-
61
-
62
-
63
-
64
-
65
-
66
-
67
-
68
-
69
-
70
-
71
-
72
-
73
-
74
-
75
-
76
-
77
-
78
-
79
-
80
-
81
-
82
-
83
-
84
-
85
-
86
-
87
-
88
-
89
-
90
-
91
-
92
-
93
-
94
-
95
-
96
-
97
-
98
-
99
-
100
-
101
-
102
-
103
-
104
-
105
-
106
-
107
-
108
-
109
-
110
-
111
-
112
-
113
-
114
-
115
-
116
-
117
-
118
-
119
-
120
-
121
-
122
-
123
-
124
-
125
-
126
-
127
-
128
-
129
-
130
-
131
-
132
-
133
-
134
-
135
-
136
-
137
-
138
-
139
-
140
-
141
-
142
-
143
-
144
-
145
-
146
-
147
-
148
-
149
-
150
-
151
-
152
-
153
-
154
-
155
-
156
-
157
-
158
-
159
-
160
-
161
-
162
-
163
-
164
-
165
-
166
-
167
-
168
-
169
-
170
-
171
-
172
-
173
-
174
-
175
-
176
-
177
-
178
-
179
-
180
-
181
-
182
-
183
-
184
-
185
-
186
-
187
-
188
-
189
-
190
-
191
-
192
-
193
-
194
-
195
-
196
-
197
-
198
-
199
-
200
-
201
-
202
-
203
-
204
-
205
-
206
-
207
-
208
-
209
-
210
-
211
-
212
-
213
-
214
-
215
-
216
-
217
-
218
-
219
-
220
-
221
-
222
-
223
-
224
-
225
-
226
-
227
-
228
 |
 |

Toyota decided to end production of vehicles and engines at Toyota Motor Corporation Australia Ltd. by the
end of 2017.
In these regions, which are expected to become increasingly important to Toyota’s business strategy, Toyota
aims to develop new products which meet the specific demands of each region, increase production and further
promote sales.
Toyota’s principal markets in the Four Regions are Brazil in South and Central America, Australia in
Oceania, South Africa in Africa and Saudi Arabia in the Middle East.
Production
Toyota and its affiliated companies produce automobiles and related parts and components through more
than 50 overseas manufacturing companies in 28 countries and regions besides Japan. Toyota’s major
manufacturing facilities include plants in Japan, the United States, Canada, the United Kingdom, France, Turkey,
Thailand, China, Taiwan, India, Indonesia, South Africa, Australia, Argentina and Brazil. Daihatsu brand
vehicles are produced at 4 factories in Japan and 4 manufacturing companies in 3 other countries, including
Indonesia and Malaysia. Hino brand vehicles are produced at 2 factories in Japan and 10 manufacturing
companies in 10 countries, including Indonesia and Thailand. For a listing of Toyota’s principal production
facilities, see “Information on the Company — Property, Plants and Equipment.”
In promoting a sustainable growth strategy, establishing a system capable of providing optimal supply of
products in the global market is integral to Toyota’s strategy.
In line with its basic policy of manufacturing where there is demand and where Toyota is truly competitive,
Toyota will make efficient use of and maximize capacity utilization at its existing plants to respond to the
expanding market and will continue to focus on making efficient capital investments as necessary. Furthermore,
Toyota will continue to place top priority on safety and quality in strengthening true competitiveness with the
aim of achieving sustainable growth.
In 2015, 75.1% of Toyota vehicles sold in overseas markets were manufactured in overseas plants by
Toyota and its unconsolidated affiliated companies. In 2015, approximately 72.2% of Toyota vehicles sold in
North America were produced in North America. Of the vehicles sold in Europe in 2015, approximately 76.3%
were produced in Europe. In fiscal 2016, Toyota produced on a consolidated basis 3,981 thousand vehicles in
Japan and 4,595 thousand vehicles overseas, compared to 4,125 thousand vehicles in Japan and 4,805 thousand
vehicles overseas in fiscal 2015.
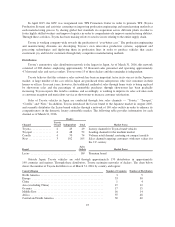
The following table shows the worldwide vehicle unit production by Toyota for the periods shown. These
production figures do not include vehicles produced by Toyota’s unconsolidated affiliated companies. The sales
unit information elsewhere in this annual report includes sales of vehicles produced by these affiliated
companies. Vehicles produced by Daihatsu and Hino are included in the vehicle production figures set forth
below.
Year Ended March 31,
2012 2013 2014 2015 2016
Units Produced ............................ 7,435,781 8,698,454 9,032,165 8,929,887 8,575,899
Toyota closely monitors its actual units of sale, market share and units of production data and uses this
information to allocate resources to existing manufacturing facilities and to plan for future expansions.
See “— Capital Expenditures and Divestitures” for a description of Toyota’s recent investments in
completed plant constructions and for a description of Toyota’s current investments in ongoing plant
constructions.
23