Toyota 2015 Annual Report Download - page 72
Download and view the complete annual report
Please find page 72 of the 2015 Toyota annual report below. You can navigate through the pages in the report by either clicking on the pages listed below, or by using the keyword search tool below to find specific information within the annual report.-
 1
1 -
2
-
3
-
4
-
5
-
6
-
7
-
8
-
9
-
10
-
11
-
12
-
13
-
14
-
15
-
16
-
17
-
18
-
19
-
20
-
21
-
22
-
23
-
24
-
25
-
26
-
27
-
28
-
29
-
30
-
31
-
32
-
33
-
34
-
35
-
36
-
37
-
38
-
39
-
40
-
41
-
42
-
43
-
44
-
45
-
46
-
47
-
48
-
49
-
50
-
51
-
52
-
53
-
54
-
55
-
56
-
57
-
58
-
59
-
60
-
61
-
 62
62 -
 63
63 -
 64
64 -
 65
65 -
 66
66 -
 67
67 -
 68
68 -
 69
69 -
 70
70 -
 71
71 -
 72
72 -
 73
73 -
 74
74 -
 75
75 -
 76
76 -
 77
77 -
 78
78 -
 79
79 -
 80
80 -
 81
81 -
 82
82 -
83
-
84
-
85
-
86
-
87
-
88
-
89
-
90
-
91
-
92
-
93
-
94
-
95
-
96
-
97
-
98
-
99
-
100
-
101
-
102
-
103
-
104
-
105
-
106
-
107
-
108
-
109
-
110
-
111
-
112
-
113
-
114
-
115
-
116
-
117
-
118
-
119
-
120
-
121
-
122
-
123
-
124
-
125
-
126
-
127
-
128
-
129
-
130
-
131
-
132
-
133
-
134
-
135
-
136
-
137
-
138
-
139
-
140
-
141
-
142
-
143
-
144
-
145
-
146
-
147
-
148
-
149
-
150
-
151
-
152
-
153
-
154
-
155
-
156
-
157
-
158
-
159
-
160
-
161
-
162
-
163
-
164
-
165
-
166
-
167
-
168
-
169
-
170
-
171
-
172
-
173
-
174
-
175
-
176
-
177
-
178
-
179
-
180
-
181
-
182
-
183
-
184
-
185
-
186
-
187
-
188
-
189
-
190
-
191
-
192
-
193
-
194
-
195
-
196
-
197
-
198
-
199
-
200
-
201
-
202
-
203
-
204
-
205
-
206
-
207
-
208
-
209
-
210
-
211
-
212
-
213
-
214
-
215
-
216
-
217
-
218
-
219
-
220
-
221
-
222
-
223
-
224
-
225
-
226
-
227
-
228
 |
 |

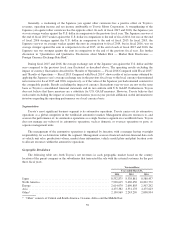
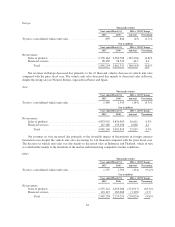
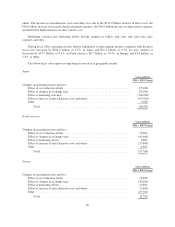
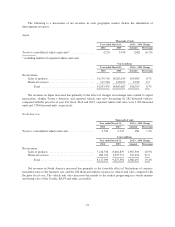
Asia
Yen in millions
2016 v. 2015 Change
Changes in operating income and loss:
Effect of cost reduction efforts .............................................. 20,000
Effect of changes in exchange rates .......................................... 30,000
Effect of marketing activities ............................................... (5,000)
Effect of increase of miscellaneous costs and others ............................. (35,000)
Other .................................................................. 17,407
Total .............................................................. 27,407
Other
Yen in millions
2016 v. 2015 Change
Changes in operating income and loss:
Effect of cost reduction efforts .............................................. 5,000
Effect of changes in exchange rates .......................................... (45,000)
Effect of marketing efforts ................................................. 45,000
Effect of increase of miscellaneous costs and others ............................. (5,000)
Other .................................................................. (2,600)
Total .............................................................. (2,600)
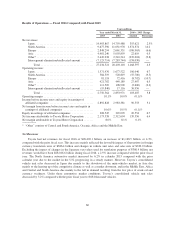
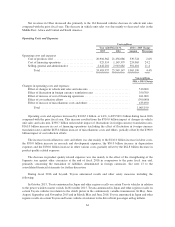
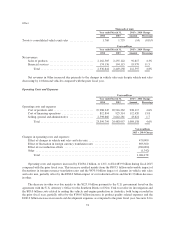
Other Income and Expenses
Interest and dividend income increased by ¥10.7 billion, or 7.3%, to ¥157.8 billion during fiscal 2016
compared with the prior fiscal year.
Interest expense increased by ¥12.5 billion, or 54.8%, to ¥35.4 billion during fiscal 2016 compared with the
prior fiscal year.
Foreign exchange gain (loss), net decreased by ¥93.7 billion to a loss of ¥5.5 billion during fiscal 2016
compared with the prior fiscal year. Foreign exchange gains and losses include the differences between the value
of foreign currency denominated assets and liabilities recognized through transactions in foreign currencies
translated at prevailing exchange rates and the value at the date the transaction settled during the fiscal year,
including those settled using forward foreign currency exchange contracts, or the value translated by appropriate
year-end exchange rates. The ¥93.7 billion decrease in foreign exchange gain (loss), net was due mainly to the
gains recorded in fiscal 2015 resulting from the Japanese yen being weaker against foreign currencies at the dates
of settlement of the foreign currency trade accounts receivable than at the dates of the transactions.
Other income, net increased by ¥82.6 billion to ¥12.5 billion during fiscal 2016 compared with the prior
fiscal year. The increase was due mainly to the effect of the reissuance of treasury stock for Toyota Mobility
Foundation, a General Incorporated Foundation, being recorded in the prior fiscal year. See note 17 to the
consolidated financial statements for further discussion.
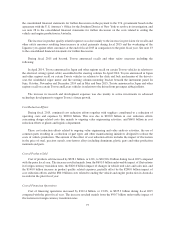
Income Taxes
The provision for income taxes decreased by ¥15.2 billion, or 1.7%, to ¥878.2 billion during fiscal 2016
compared with the prior fiscal year due mainly to the reduction of the corporation tax rate resulting from fiscal
67