Toyota 2015 Annual Report Download - page 93
Download and view the complete annual report
Please find page 93 of the 2015 Toyota annual report below. You can navigate through the pages in the report by either clicking on the pages listed below, or by using the keyword search tool below to find specific information within the annual report.-
 1
1 -
2
-
3
-
4
-
5
-
6
-
7
-
8
-
9
-
10
-
11
-
12
-
13
-
14
-
15
-
16
-
17
-
18
-
19
-
20
-
21
-
22
-
23
-
24
-
25
-
26
-
27
-
28
-
29
-
30
-
31
-
32
-
33
-
34
-
35
-
36
-
37
-
38
-
39
-
40
-
41
-
42
-
43
-
44
-
45
-
46
-
47
-
48
-
49
-
50
-
51
-
52
-
53
-
54
-
55
-
56
-
57
-
58
-
59
-
60
-
61
-
62
-
63
-
64
-
65
-
66
-
67
-
68
-
69
-
70
-
71
-
72
-
73
-
74
-
75
-
76
-
77
-
78
-
79
-
80
-
81
-
82
-
 83
83 -
 84
84 -
 85
85 -
 86
86 -
 87
87 -
 88
88 -
 89
89 -
 90
90 -
 91
91 -
 92
92 -
 93
93 -
 94
94 -
 95
95 -
 96
96 -
 97
97 -
 98
98 -
 99
99 -
 100
100 -
 101
101 -
 102
102 -
 103
103 -
104
-
105
-
106
-
107
-
108
-
109
-
110
-
111
-
112
-
113
-
114
-
115
-
116
-
117
-
118
-
119
-
120
-
121
-
122
-
123
-
124
-
125
-
126
-
127
-
128
-
129
-
130
-
131
-
132
-
133
-
134
-
135
-
136
-
137
-
138
-
139
-
140
-
141
-
142
-
143
-
144
-
145
-
146
-
147
-
148
-
149
-
150
-
151
-
152
-
153
-
154
-
155
-
156
-
157
-
158
-
159
-
160
-
161
-
162
-
163
-
164
-
165
-
166
-
167
-
168
-
169
-
170
-
171
-
172
-
173
-
174
-
175
-
176
-
177
-
178
-
179
-
180
-
181
-
182
-
183
-
184
-
185
-
186
-
187
-
188
-
189
-
190
-
191
-
192
-
193
-
194
-
195
-
196
-
197
-
198
-
199
-
200
-
201
-
202
-
203
-
204
-
205
-
206
-
207
-
208
-
209
-
210
-
211
-
212
-
213
-
214
-
215
-
216
-
217
-
218
-
219
-
220
-
221
-
222
-
223
-
224
-
225
-
226
-
227
-
228
 |
 |
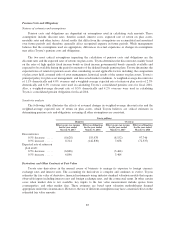
Net cash used in investing activities decreased by ¥522.7 billion to ¥3,813.4 billion for fiscal 2015,
compared with ¥4,336.2 billion for fiscal 2014. The decrease was primarily attributable to the ¥907.6 billion
decrease in purchases of marketable securities and security investments, partially offset by the ¥502.5 billion
increase in purchases of equipment leased to others.
Net cash used in financing activities was ¥423.5 billion for fiscal 2016, compared with net cash provided by
financing activities of ¥306.0 billion for fiscal 2015, a ¥729.6 billion change. The change was primarily
attributable to the ¥713.9 billion increase in payments of long-term debt and a ¥430.3 billion increase in
repurchase and reissuance of treasury stock, partially offset by the ¥474.9 billion proceeds from the issuance of
Model AA Class Shares.
Net cash provided by financing activities decreased by ¥613.4 billion to ¥306.0 billion for fiscal 2015,
compared with ¥919.4 billion for fiscal 2014. The decrease was primarily attributable to the ¥158.9 billion
increase in dividends paid and the ¥356.9 billion increase in repurchase and reissuance of treasury stock. In
addition, the increase in payments of debt exceeded the increase in proceeds from issuance of debt.
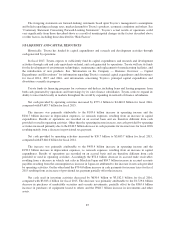
Total capital expenditures for property, plant and equipment, excluding vehicles and equipment on operating
leases, were ¥1,282.5 billion during fiscal 2016, an increase of 11.9% from the ¥1,146.3 billion in total capital
expenditures during the prior fiscal year. This increase was due primarily to an increase in investments in Japan
and Asia.
Total capital expenditures for vehicles and equipment on operating leases were ¥2,776.6 billion during fiscal
2016, an increase of 25.6% from the ¥2,211.2 billion in total capital expenditures during the prior fiscal year.
This increase was due primarily to an increase in investments in the financial services operations.
Toyota expects investments in property, plant and equipment, excluding vehicles and equipment on
operating leases, to be approximately ¥1,350.0 billion during fiscal 2017.
Cash and cash equivalents were ¥2,939.4 billion as of March 31, 2016. Most of Toyota’s cash and cash
equivalents are held in Japanese yen or in U.S. dollars. In addition, time deposits were ¥1,032.0 billion and
marketable securities were ¥1,511.3 billion as of March 31, 2016.
Liquid assets, which Toyota defines as cash and cash equivalents, time deposits, marketable debt securities
and its investment in monetary trust funds, increased during fiscal 2016 by ¥634.1 billion, or 6.4%, to
¥10,570.2 billion.
Trade accounts and notes receivable, less allowance for doubtful accounts decreased during fiscal 2016 by
¥108.5 billion, or 5.1%, to ¥2,000.1 billion. This decrease was due mainly to the fluctuations in foreign currency
translation rates.
Inventories decreased during fiscal 2016 by ¥76.1 billion, or 3.6%, to ¥2,061.5 billion. This decrease was
due mainly to the fluctuations in foreign currency translation rates.
Total finance receivables, net decreased during fiscal 2016 by ¥916.7 billion, or 5.9%, to ¥14,555.6 billion.
This decrease was due mainly to the fluctuations in foreign currency translation rates. As of March 31, 2016,
finance receivables were geographically distributed as follows: in North America 59.1%, in Asia 11.9%, in
Europe 10.3%, in Japan 8.3% and in Other 10.4%.
Marketable securities and other securities investments, including those included in current assets, decreased
during fiscal 2016 by ¥1,463.0 billion, or 14.0%, reflecting the redemptions of marketable securities and security
investments, and the fluctuations in foreign currency translation rates.
88