Toyota 2015 Annual Report Download - page 64
Download and view the complete annual report
Please find page 64 of the 2015 Toyota annual report below. You can navigate through the pages in the report by either clicking on the pages listed below, or by using the keyword search tool below to find specific information within the annual report.-
 1
1 -
2
-
3
-
4
-
5
-
6
-
7
-
8
-
9
-
10
-
11
-
12
-
13
-
14
-
15
-
16
-
17
-
18
-
19
-
20
-
21
-
22
-
23
-
24
-
25
-
26
-
27
-
28
-
29
-
30
-
31
-
32
-
33
-
34
-
35
-
36
-
37
-
38
-
39
-
40
-
41
-
42
-
43
-
44
-
45
-
46
-
47
-
48
-
49
-
50
-
51
-
52
-
53
-
 54
54 -
 55
55 -
 56
56 -
 57
57 -
 58
58 -
 59
59 -
 60
60 -
 61
61 -
 62
62 -
 63
63 -
 64
64 -
 65
65 -
 66
66 -
 67
67 -
 68
68 -
 69
69 -
 70
70 -
 71
71 -
 72
72 -
 73
73 -
 74
74 -
75
-
76
-
77
-
78
-
79
-
80
-
81
-
82
-
83
-
84
-
85
-
86
-
87
-
88
-
89
-
90
-
91
-
92
-
93
-
94
-
95
-
96
-
97
-
98
-
99
-
100
-
101
-
102
-
103
-
104
-
105
-
106
-
107
-
108
-
109
-
110
-
111
-
112
-
113
-
114
-
115
-
116
-
117
-
118
-
119
-
120
-
121
-
122
-
123
-
124
-
125
-
126
-
127
-
128
-
129
-
130
-
131
-
132
-
133
-
134
-
135
-
136
-
137
-
138
-
139
-
140
-
141
-
142
-
143
-
144
-
145
-
146
-
147
-
148
-
149
-
150
-
151
-
152
-
153
-
154
-
155
-
156
-
157
-
158
-
159
-
160
-
161
-
162
-
163
-
164
-
165
-
166
-
167
-
168
-
169
-
170
-
171
-
172
-
173
-
174
-
175
-
176
-
177
-
178
-
179
-
180
-
181
-
182
-
183
-
184
-
185
-
186
-
187
-
188
-
189
-
190
-
191
-
192
-
193
-
194
-
195
-
196
-
197
-
198
-
199
-
200
-
201
-
202
-
203
-
204
-
205
-
206
-
207
-
208
-
209
-
210
-
211
-
212
-
213
-
214
-
215
-
216
-
217
-
218
-
219
-
220
-
221
-
222
-
223
-
224
-
225
-
226
-
227
-
228
 |
 |

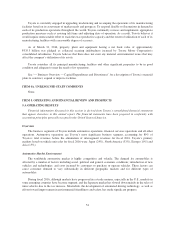
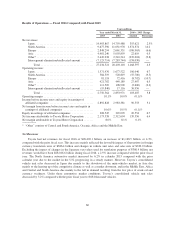
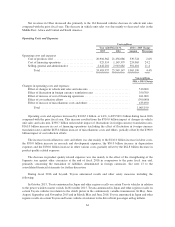
Generally, a weakening of the Japanese yen against other currencies has a positive effect on Toyota’s
revenues, operating income and net income attributable to Toyota Motor Corporation. A strengthening of the
Japanese yen against other currencies has the opposite effect. In each of fiscal 2015 and 2016, the Japanese yen
was on average weaker against the U.S. dollar in comparison to the previous fiscal year. The Japanese yen was at
the end of fiscal 2015 weaker against the U.S. dollar in comparison to the end of fiscal 2014, but was at the end
of fiscal 2016 stronger against the U.S. dollar in comparison to the end of fiscal 2015. In fiscal 2015, the
Japanese yen was on average weaker against the euro in comparison to fiscal 2014, but in fiscal 2016, was on
average stronger against the euro in comparison to fiscal 2015. At the end of each of fiscal 2015 and 2016, the
Japanese yen was stronger against the euro in comparison to the end of the previous fiscal year. See further
discussion in “Quantitative and Qualitative Disclosures about Market Risk — Market Risk Disclosures —
Foreign Currency Exchange Rate Risk”.
During fiscal 2015 and 2016, the average exchange rate of the Japanese yen against the U.S. dollar and the
euro compared to the previous fiscal year fluctuated as described above. The operating results excluding the
impact of currency fluctuations described in “Results of Operations — Fiscal 2016 Compared with Fiscal 2015”
and “Results of Operations — Fiscal 2015 Compared with Fiscal 2014” show results of net revenues obtained by
applying the Japanese yen’s average exchange rate in the previous fiscal year to the local currency-denominated
net revenues for fiscal 2015 and 2016, respectively, as if the value of the Japanese yen had remained constant for
the comparable periods. Results excluding the impact of currency fluctuations year-on-year are not on the same
basis as Toyota’s consolidated financial statements and do not conform with U.S. GAAP. Furthermore, Toyota
does not believe that these measures are a substitute for U.S. GAAP measures. However, Toyota believes that
such results excluding the impact of currency fluctuations year-on-year provide additional useful information to
investors regarding the operating performance on a local currency basis.
Segmentation
Toyota’s most significant business segment is its automotive operations. Toyota carries out its automotive
operations as a global competitor in the worldwide automotive market. Management allocates resources to, and
assesses the performance of, its automotive operations as a single business segment on a worldwide basis. Toyota
does not manage any subset of its automotive operations, such as domestic or overseas operations or parts, as
separate management units.
The management of the automotive operations is organized by function, with a manager having oversight
responsibility for each function within the segment. Management assesses financial and non-financial data such
as vehicle unit sales, production volume, market share information, vehicle model plans and plant location costs
to allocate resources within the automotive operations.
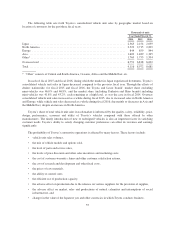
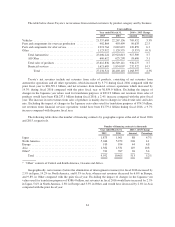
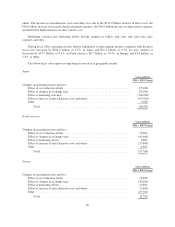
Geographic Breakdown
The following table sets forth Toyota’s net revenues in each geographic market based on the country
location of the parent company or the subsidiaries that transacted the sale with the external customer for the past
three fiscal years.
Yen in millions
Year ended March 31,
2014 2015 2016
Japan ....................................................... 8,532,875 8,338,881 8,588,437
North America ................................................ 7,938,615 9,430,450 10,822,772
Europe ...................................................... 2,614,070 2,690,803 2,507,292
Asia ........................................................ 4,475,382 4,531,178 4,475,623
Other* ...................................................... 2,130,969 2,243,209 2,008,994
* “Other” consists of Central and South America, Oceania, Africa and the Middle East.
59