Toyota 2015 Annual Report Download - page 92
Download and view the complete annual report
Please find page 92 of the 2015 Toyota annual report below. You can navigate through the pages in the report by either clicking on the pages listed below, or by using the keyword search tool below to find specific information within the annual report.-
 1
1 -
2
-
3
-
4
-
5
-
6
-
7
-
8
-
9
-
10
-
11
-
12
-
13
-
14
-
15
-
16
-
17
-
18
-
19
-
20
-
21
-
22
-
23
-
24
-
25
-
26
-
27
-
28
-
29
-
30
-
31
-
32
-
33
-
34
-
35
-
36
-
37
-
38
-
39
-
40
-
41
-
42
-
43
-
44
-
45
-
46
-
47
-
48
-
49
-
50
-
51
-
52
-
53
-
54
-
55
-
56
-
57
-
58
-
59
-
60
-
61
-
62
-
63
-
64
-
65
-
66
-
67
-
68
-
69
-
70
-
71
-
72
-
73
-
74
-
75
-
76
-
77
-
78
-
79
-
80
-
81
-
 82
82 -
 83
83 -
 84
84 -
 85
85 -
 86
86 -
 87
87 -
 88
88 -
 89
89 -
 90
90 -
 91
91 -
 92
92 -
 93
93 -
 94
94 -
 95
95 -
 96
96 -
 97
97 -
 98
98 -
 99
99 -
 100
100 -
 101
101 -
 102
102 -
103
-
104
-
105
-
106
-
107
-
108
-
109
-
110
-
111
-
112
-
113
-
114
-
115
-
116
-
117
-
118
-
119
-
120
-
121
-
122
-
123
-
124
-
125
-
126
-
127
-
128
-
129
-
130
-
131
-
132
-
133
-
134
-
135
-
136
-
137
-
138
-
139
-
140
-
141
-
142
-
143
-
144
-
145
-
146
-
147
-
148
-
149
-
150
-
151
-
152
-
153
-
154
-
155
-
156
-
157
-
158
-
159
-
160
-
161
-
162
-
163
-
164
-
165
-
166
-
167
-
168
-
169
-
170
-
171
-
172
-
173
-
174
-
175
-
176
-
177
-
178
-
179
-
180
-
181
-
182
-
183
-
184
-
185
-
186
-
187
-
188
-
189
-
190
-
191
-
192
-
193
-
194
-
195
-
196
-
197
-
198
-
199
-
200
-
201
-
202
-
203
-
204
-
205
-
206
-
207
-
208
-
209
-
210
-
211
-
212
-
213
-
214
-
215
-
216
-
217
-
218
-
219
-
220
-
221
-
222
-
223
-
224
-
225
-
226
-
227
-
228
 |
 |
The foregoing statements are forward-looking statements based upon Toyota’s management’s assumptions
and beliefs regarding exchange rates, market demand for Toyota’s products, economic conditions and others. See
“Cautionary Statement Concerning Forward-Looking Statements”. Toyota’s actual results of operations could
vary significantly from those described above as a result of unanticipated changes in the factors described above
or other factors, including those described in “Risk Factors”.
5.B LIQUIDITY AND CAPITAL RESOURCES
Historically, Toyota has funded its capital expenditures and research and development activities through
cash generated by operations.
In fiscal 2017, Toyota expects to sufficiently fund its capital expenditures and research and development
activities through cash and cash equivalents on hand, and cash generated by operations. Toyota will use its funds
for the development of environment technologies, maintenance and replacement of manufacturing facilities, and
the introduction of new products. See “Information on the Company — Business Overview — Capital
Expenditures and Divestitures” for information regarding Toyota’s material capital expenditures and divestitures
for fiscal 2014, 2015 and 2016, and information concerning Toyota’s principal capital expenditures and
divestitures currently in progress.
Toyota funds its financing programs for customers and dealers, including loans and leasing programs, from
both cash generated by operations and borrowings by its sales finance subsidiaries. Toyota seeks to expand its
ability to raise funds locally in markets throughout the world by expanding its network of finance subsidiaries.
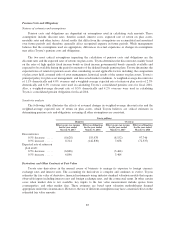
Net cash provided by operating activities increased by ¥775.1 billion to ¥4,460.8 billion for fiscal 2016,
compared with ¥3,685.7 billion for fiscal 2015.
The increase was primarily attributable to the ¥103.4 billion increase in operating income and the
¥216.7 billion increase in depreciation expenses, i.e. noncash expenses, resulting from an increase in capital
expenditures. Results of operations are recorded on an accrual basis and are therefore different from cash
provided or used in operating activities. Other than the operating income increase, net cash provided by operating
activities increased primarily due to the ¥240.5 billion decrease in cash payments for income taxes for fiscal 2016
resulting mainly from a decrease in provisional tax payment.
Net cash provided by operating activities increased by ¥39.7 billion to ¥3,685.7 billion for fiscal 2015,
compared with ¥3,646.0 billion for fiscal 2014.
The increase was primarily attributable to the ¥458.4 billion increase in operating income and the
¥158.2 billion increase in depreciation expenses, i.e. noncash expenses, resulting from an increase in capital
expenditures. Results of operations are recorded on an accrual basis and are therefore different from cash
provided or used in operating activities. Accordingly the ¥52.4 billion decrease in accrued trade receivables
resulting from a decrease in vehicle unit sales in March in Japan and ¥84.7 billion increase in accrued accounts
payables resulting from the consumption tax increase in Japan are attributed to the increase in net cash provided
by operating activities. On the other hand the ¥734.6 billion increase in cash payments for income taxes for fiscal
2015 resulting from an increase of provisional tax payment partially offset the increase.
Net cash used in investing activities decreased by ¥630.9 billion to ¥3,182.5 billion for fiscal 2016,
compared with ¥3,813.4 billion for fiscal 2015. The decrease was primarily attributable to the ¥1,729.6 billion
decrease in purchases of marketable securities and security investments, partially offset by the ¥565.4 billion
increase in purchases of equipment leased to others and the ¥948.7 billion increase in investments and other
assets.
87