Toyota 2015 Annual Report Download - page 68
Download and view the complete annual report
Please find page 68 of the 2015 Toyota annual report below. You can navigate through the pages in the report by either clicking on the pages listed below, or by using the keyword search tool below to find specific information within the annual report.-
 1
1 -
2
-
3
-
4
-
5
-
6
-
7
-
8
-
9
-
10
-
11
-
12
-
13
-
14
-
15
-
16
-
17
-
18
-
19
-
20
-
21
-
22
-
23
-
24
-
25
-
26
-
27
-
28
-
29
-
30
-
31
-
32
-
33
-
34
-
35
-
36
-
37
-
38
-
39
-
40
-
41
-
42
-
43
-
44
-
45
-
46
-
47
-
48
-
49
-
50
-
51
-
52
-
53
-
54
-
55
-
56
-
57
-
 58
58 -
 59
59 -
 60
60 -
 61
61 -
 62
62 -
 63
63 -
 64
64 -
 65
65 -
 66
66 -
 67
67 -
 68
68 -
 69
69 -
 70
70 -
 71
71 -
 72
72 -
 73
73 -
 74
74 -
 75
75 -
 76
76 -
 77
77 -
 78
78 -
79
-
80
-
81
-
82
-
83
-
84
-
85
-
86
-
87
-
88
-
89
-
90
-
91
-
92
-
93
-
94
-
95
-
96
-
97
-
98
-
99
-
100
-
101
-
102
-
103
-
104
-
105
-
106
-
107
-
108
-
109
-
110
-
111
-
112
-
113
-
114
-
115
-
116
-
117
-
118
-
119
-
120
-
121
-
122
-
123
-
124
-
125
-
126
-
127
-
128
-
129
-
130
-
131
-
132
-
133
-
134
-
135
-
136
-
137
-
138
-
139
-
140
-
141
-
142
-
143
-
144
-
145
-
146
-
147
-
148
-
149
-
150
-
151
-
152
-
153
-
154
-
155
-
156
-
157
-
158
-
159
-
160
-
161
-
162
-
163
-
164
-
165
-
166
-
167
-
168
-
169
-
170
-
171
-
172
-
173
-
174
-
175
-
176
-
177
-
178
-
179
-
180
-
181
-
182
-
183
-
184
-
185
-
186
-
187
-
188
-
189
-
190
-
191
-
192
-
193
-
194
-
195
-
196
-
197
-
198
-
199
-
200
-
201
-
202
-
203
-
204
-
205
-
206
-
207
-
208
-
209
-
210
-
211
-
212
-
213
-
214
-
215
-
216
-
217
-
218
-
219
-
220
-
221
-
222
-
223
-
224
-
225
-
226
-
227
-
228
 |
 |

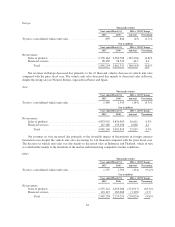
Europe
Thousands of units
Year ended March 31, 2016 v. 2015 Change
2015 2016 Amount Percentage
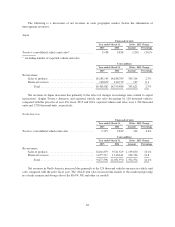
Toyota’s consolidated vehicle unit sales ................... 859 844 (15) (1.7)%
Yen in millions
Year ended March 31, 2016 v. 2015 Change
2015 2016 Amount Percentage
Net revenues:
Sales of products ................................. 2,750,164 2,562,788 (187,376) (6.8)%
Financial services ................................ 98,130 98,543 413 0.4
Total ...................................... 2,848,294 2,661,331 (186,963) (6.6)%
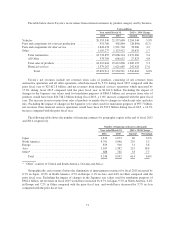
Net revenues in Europe decreased due primarily to the 15 thousand vehicles decrease in vehicle unit sales
compared with the prior fiscal year. The vehicle unit sales decreased due mainly to decreased sales in Russia,
despite the strong sales in Western Europe, especially in France and Spain.
Asia
Thousands of units
Year ended March 31, 2016 v. 2015 Change
2015 2016 Amount Percentage
Toyota’s consolidated vehicle unit sales ................... 1,489 1,345 (144) (9.7)%
Yen in millions
Year ended March 31, 2016 v. 2015 Change
2015 2016 Amount Percentage
Net revenues:
Sales of products ................................. 4,833,952 4,850,563 16,611 0.3%
Financial services ................................ 147,288 153,296 6,008 4.1
Total ...................................... 4,981,240 5,003,859 22,619 0.5%
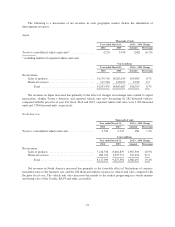
Net revenues in Asia increased due primarily to the favorable impact of fluctuations in foreign currency
translation rates despite the vehicle unit sales decreasing by 144 thousand compared with the prior fiscal year.
The decrease in vehicle unit sales was due mainly to decreased sales in Indonesia and Thailand, which in turn
was attributable mainly to the downturn of the market and intensifying competitive market conditions.
Other
Thousands of units
Year ended March 31, 2016 v. 2015 Change
2015 2016 Amount Percentage
Toyota’s consolidated vehicle unit sales ................... 1,755 1,594 (161) (9.2)%
Yen in millions
Year ended March 31, 2016 v. 2015 Change
2015 2016 Amount Percentage
Net revenues:
Sales of products ................................. 2,255,122 2,023,206 (231,917) (10.3)%
Financial services ................................ 194,115 187,008 (7,107) (3.7)
Total ...................................... 2,449,238 2,210,214 (239,024) (9.8)%
63