Toyota 2015 Annual Report Download - page 90
Download and view the complete annual report
Please find page 90 of the 2015 Toyota annual report below. You can navigate through the pages in the report by either clicking on the pages listed below, or by using the keyword search tool below to find specific information within the annual report.-
 1
1 -
2
-
3
-
4
-
5
-
6
-
7
-
8
-
9
-
10
-
11
-
12
-
13
-
14
-
15
-
16
-
17
-
18
-
19
-
20
-
21
-
22
-
23
-
24
-
25
-
26
-
27
-
28
-
29
-
30
-
31
-
32
-
33
-
34
-
35
-
36
-
37
-
38
-
39
-
40
-
41
-
42
-
43
-
44
-
45
-
46
-
47
-
48
-
49
-
50
-
51
-
52
-
53
-
54
-
55
-
56
-
57
-
58
-
59
-
60
-
61
-
62
-
63
-
64
-
65
-
66
-
67
-
68
-
69
-
70
-
71
-
72
-
73
-
74
-
75
-
76
-
77
-
78
-
79
-
 80
80 -
 81
81 -
 82
82 -
 83
83 -
 84
84 -
 85
85 -
 86
86 -
 87
87 -
 88
88 -
 89
89 -
 90
90 -
 91
91 -
 92
92 -
 93
93 -
 94
94 -
 95
95 -
 96
96 -
 97
97 -
 98
98 -
 99
99 -
 100
100 -
101
-
102
-
103
-
104
-
105
-
106
-
107
-
108
-
109
-
110
-
111
-
112
-
113
-
114
-
115
-
116
-
117
-
118
-
119
-
120
-
121
-
122
-
123
-
124
-
125
-
126
-
127
-
128
-
129
-
130
-
131
-
132
-
133
-
134
-
135
-
136
-
137
-
138
-
139
-
140
-
141
-
142
-
143
-
144
-
145
-
146
-
147
-
148
-
149
-
150
-
151
-
152
-
153
-
154
-
155
-
156
-
157
-
158
-
159
-
160
-
161
-
162
-
163
-
164
-
165
-
166
-
167
-
168
-
169
-
170
-
171
-
172
-
173
-
174
-
175
-
176
-
177
-
178
-
179
-
180
-
181
-
182
-
183
-
184
-
185
-
186
-
187
-
188
-
189
-
190
-
191
-
192
-
193
-
194
-
195
-
196
-
197
-
198
-
199
-
200
-
201
-
202
-
203
-
204
-
205
-
206
-
207
-
208
-
209
-
210
-
211
-
212
-
213
-
214
-
215
-
216
-
217
-
218
-
219
-
220
-
221
-
222
-
223
-
224
-
225
-
226
-
227
-
228
 |
 |

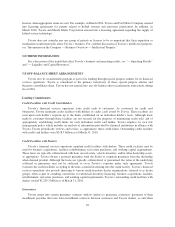
Pension Costs and Obligations
Natures of estimates and assumptions
Pension costs and obligations are dependent on assumptions used in calculating such amounts. These
assumptions include discount rates, benefits earned, interest costs, expected rate of return on plan assets,
mortality rates and other factors. Actual results that differ from the assumptions are accumulated and amortized
over future periods and, therefore, generally affect recognized expense in future periods. While management
believes that the assumptions used are appropriate, differences in actual experience or changes in assumptions
may affect Toyota’s pension costs and obligations.
The two most critical assumptions impacting the calculation of pension costs and obligations are the
discount rates and the expected rates of returns on plan assets. Toyota determines the discount rates mainly based
on the rates of high quality fixed income bonds or fixed income governmental bonds currently available and
expected to be available during the period to maturity of the defined benefit pension plans. Toyota determines the
expected rates of return for pension assets after considering several applicable factors including, the composition
of plan assets held, assumed risks of asset management, historical results of the returns on plan assets, Toyota’s
principal policy for plan asset management, and forecasted market conditions. A weighted-average discount rate
of 1.1% domestically and 4.0% overseas and a weighted-average expected rate of return on plan assets of 2.5%
domestically and 6.3% overseas were used in calculating Toyota’s consolidated pension costs for fiscal 2016.
Also, a weighted-average discount rate of 0.5% domestically and 4.2% overseas were used in calculating
Toyota’s consolidated pension obligations for fiscal 2016.
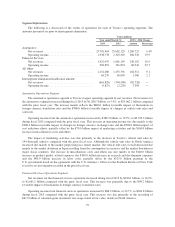
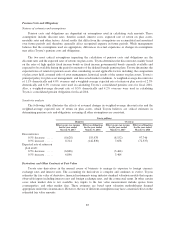
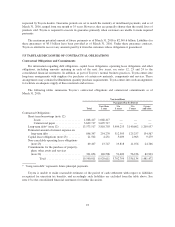
Sensitivity analysis
The following table illustrates the effects of assumed changes in weighted-average discount rates and the
weighted-average expected rate of return on plan assets, which Toyota believes are critical estimates in
determining pension costs and obligations, assuming all other assumptions are consistent.
Yen in millions
Domestic Overseas
Effect on pre-tax income
for the year ended
March 31, 2017
Effect on obligations
for the year ended
March 31, 2016
Effect on pre-tax income
for the year ended
March 31, 2017
Effect on obligations
for the year ended
March 31, 2016
Discount rates
0.5% decrease ..... (8,628) 155,478 (8,152) 97,746
0.5% increase ...... 8,314 (142,830) 7,658 (72,537)
Expected rate of return on
plan assets
0.5% decrease ..... (6,846) (3,464)
0.5% increase ...... 6,846 3,464
Derivatives and Other Contracts at Fair Value
Toyota uses derivatives in the normal course of business to manage its exposure to foreign currency
exchange rates and interest rates. The accounting for derivatives is complex and continues to evolve. Toyota
estimates the fair value of derivative financial instruments using industry-standard valuation models that require
observable inputs including interest rates and foreign exchange rates, and the contractual terms. In other certain
cases when market data is not available, key inputs to the fair value measurement include quotes from
counterparties, and other market data. These estimates are based upon valuation methodologies deemed
appropriate under the circumstances. However, the use of different assumptions may have a material effect on the
estimated fair value amounts.
85