Toyota 2015 Annual Report Download - page 212
Download and view the complete annual report
Please find page 212 of the 2015 Toyota annual report below. You can navigate through the pages in the report by either clicking on the pages listed below, or by using the keyword search tool below to find specific information within the annual report.-
 1
1 -
2
-
3
-
4
-
5
-
6
-
7
-
8
-
9
-
10
-
11
-
12
-
13
-
14
-
15
-
16
-
17
-
18
-
19
-
20
-
21
-
22
-
23
-
24
-
25
-
26
-
27
-
28
-
29
-
30
-
31
-
32
-
33
-
34
-
35
-
36
-
37
-
38
-
39
-
40
-
41
-
42
-
43
-
44
-
45
-
46
-
47
-
48
-
49
-
50
-
51
-
52
-
53
-
54
-
55
-
56
-
57
-
58
-
59
-
60
-
61
-
62
-
63
-
64
-
65
-
66
-
67
-
68
-
69
-
70
-
71
-
72
-
73
-
74
-
75
-
76
-
77
-
78
-
79
-
80
-
81
-
82
-
83
-
84
-
85
-
86
-
87
-
88
-
89
-
90
-
91
-
92
-
93
-
94
-
95
-
96
-
97
-
98
-
99
-
100
-
101
-
102
-
103
-
104
-
105
-
106
-
107
-
108
-
109
-
110
-
111
-
112
-
113
-
114
-
115
-
116
-
117
-
118
-
119
-
120
-
121
-
122
-
123
-
124
-
125
-
126
-
127
-
128
-
129
-
130
-
131
-
132
-
133
-
134
-
135
-
136
-
137
-
138
-
139
-
140
-
141
-
142
-
143
-
144
-
145
-
146
-
147
-
148
-
149
-
150
-
151
-
152
-
153
-
154
-
155
-
156
-
157
-
158
-
159
-
160
-
161
-
162
-
163
-
164
-
165
-
166
-
167
-
168
-
169
-
170
-
171
-
172
-
173
-
174
-
175
-
176
-
177
-
178
-
179
-
180
-
181
-
182
-
183
-
184
-
185
-
186
-
187
-
188
-
189
-
190
-
191
-
192
-
193
-
194
-
195
-
196
-
197
-
198
-
199
-
200
-
201
-
 202
202 -
 203
203 -
 204
204 -
 205
205 -
 206
206 -
 207
207 -
 208
208 -
 209
209 -
 210
210 -
 211
211 -
 212
212 -
 213
213 -
 214
214 -
 215
215 -
 216
216 -
 217
217 -
 218
218 -
 219
219 -
 220
220 -
 221
221 -
 222
222 -
223
-
224
-
225
-
226
-
227
-
228
 |
 |

TOYOTA MOTOR CORPORATION
NOTES TO CONSOLIDATED FINANCIAL STATEMENTS—(Continued)
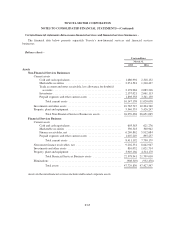
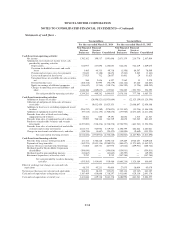
The following table shows Toyota Motor Corporation shareholders’ equity per share as of March 31, 2015
and 2016. Toyota Motor Corporation shareholders’ equity per share amounts are calculated by dividing Toyota
Motor Corporation shareholders’ equities’ amount at the end of each period by the number of shares issued and
outstanding, excluding treasury stock at the end of the corresponding period.
Yen in
millions
Thousands
of shares Yen
Toyota Motor
Corporation
shareholders’
equity
Common shares
issued and
outstanding
at the end of
the year
(excluding
treasury
stock)
Toyota Motor
Corporation
shareholders’
equity
per share
As of March 31, 2015 .................................... 16,788,131 3,146,814 5,334.96
As of March 31, 2016 .................................... 16,746,935 3,037,676 5,513.08
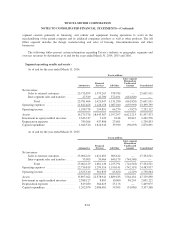
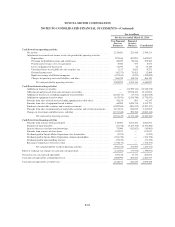
27. Fair value measurements:
In accordance with U.S.GAAP, Toyota classifies fair value into three levels of input as follows which are
used to measure it.
Level 1: Quoted prices in active markets for identical assets or liabilities
Level 2: Quoted prices for similar assets or liabilities in active markets; quoted prices for identical or
similar assets or liabilities in markets that are not active; inputs other than quoted prices that are
observable for the valuation of assets or liabilities
Level 3: Valuation of assets or liabilities using unobservable inputs which reflect the reporting entity’s
assumptions
The following table summarizes the fair values of the assets and liabilities measured at fair value on a
recurring basis as of March 31, 2015 and 2016. Transfers between levels of the fair value are recognized at the
end of their respective reporting periods:
Yen in millions
March 31, 2015
Level 1 Level 2 Level 3 Total
Assets
Cash equivalents ................................... 145,923 348,487 — 494,410
Marketable securities and other securities investments
Public and corporate bonds ...................... 6,129,824 1,038,810 12,317 7,180,951
Common stocks ............................... 2,704,814 — — 2,704,814
Other ........................................ 61,538 369,184 — 430,722
Derivative financial instruments ...................... — 338,310 1,010 339,320
Total .................................... 9,042,099 2,094,791 13,327 11,150,217
Liabilities
Derivative financial instruments ...................... — (360,731) — (360,731)
Total .................................... — (360,731) — (360,731)
F-71