Toyota 2015 Annual Report Download - page 80
Download and view the complete annual report
Please find page 80 of the 2015 Toyota annual report below. You can navigate through the pages in the report by either clicking on the pages listed below, or by using the keyword search tool below to find specific information within the annual report.-
 1
1 -
2
-
3
-
4
-
5
-
6
-
7
-
8
-
9
-
10
-
11
-
12
-
13
-
14
-
15
-
16
-
17
-
18
-
19
-
20
-
21
-
22
-
23
-
24
-
25
-
26
-
27
-
28
-
29
-
30
-
31
-
32
-
33
-
34
-
35
-
36
-
37
-
38
-
39
-
40
-
41
-
42
-
43
-
44
-
45
-
46
-
47
-
48
-
49
-
50
-
51
-
52
-
53
-
54
-
55
-
56
-
57
-
58
-
59
-
60
-
61
-
62
-
63
-
64
-
65
-
66
-
67
-
68
-
69
-
 70
70 -
 71
71 -
 72
72 -
 73
73 -
 74
74 -
 75
75 -
 76
76 -
 77
77 -
 78
78 -
 79
79 -
 80
80 -
 81
81 -
 82
82 -
 83
83 -
 84
84 -
 85
85 -
 86
86 -
 87
87 -
 88
88 -
 89
89 -
 90
90 -
91
-
92
-
93
-
94
-
95
-
96
-
97
-
98
-
99
-
100
-
101
-
102
-
103
-
104
-
105
-
106
-
107
-
108
-
109
-
110
-
111
-
112
-
113
-
114
-
115
-
116
-
117
-
118
-
119
-
120
-
121
-
122
-
123
-
124
-
125
-
126
-
127
-
128
-
129
-
130
-
131
-
132
-
133
-
134
-
135
-
136
-
137
-
138
-
139
-
140
-
141
-
142
-
143
-
144
-
145
-
146
-
147
-
148
-
149
-
150
-
151
-
152
-
153
-
154
-
155
-
156
-
157
-
158
-
159
-
160
-
161
-
162
-
163
-
164
-
165
-
166
-
167
-
168
-
169
-
170
-
171
-
172
-
173
-
174
-
175
-
176
-
177
-
178
-
179
-
180
-
181
-
182
-
183
-
184
-
185
-
186
-
187
-
188
-
189
-
190
-
191
-
192
-
193
-
194
-
195
-
196
-
197
-
198
-
199
-
200
-
201
-
202
-
203
-
204
-
205
-
206
-
207
-
208
-
209
-
210
-
211
-
212
-
213
-
214
-
215
-
216
-
217
-
218
-
219
-
220
-
221
-
222
-
223
-
224
-
225
-
226
-
227
-
228
 |
 |
the consolidated financial statements for further discussion on the payment to the U.S. government based on the
agreement with the U.S. Attorney’s Office for the Southern District of New York to resolve its investigation, and
see note 28 to the consolidated financial statements for further discussion on the costs related to ending the
vehicle and engine production in Australia.
The increase in product quality related expenses was due mainly to the increase in provisions for recalls and
other safety measures resulting from increase in actual payments during fiscal 2015 and the weakening of the
Japanese yen against other currencies at the end of fiscal 2015 in comparison to the prior fiscal year. See note 13
to the consolidated financial statements for further discussion.
During fiscal 2015 and beyond, Toyota announced recalls and other safety measures including the
following:
In April 2014, Toyota announced in Japan and other regions recall on certain Toyota vehicles in relation to
the electrical wiring (spiral cable) assembled in the steering column. In April 2014, Toyota announced in Japan
and other regions recall on certain Toyota vehicles in relation to the slide and lock mechanism of the driver’s
seat, the windshield wiper motor and the steering column mounting bracket beneath the instrument panel. In
June, October, November and December 2014 and in May and June 2015, Toyota announced in Japan and other
regions recall on certain Toyota and Lexus vehicles in relation to the driver/front passenger airbag inflator.
The increase in research and development expenses was due mainly to active investments in advanced
technology development to support Toyota’s future growth.
Cost Reduction Efforts
During fiscal 2015, continued cost reduction efforts together with suppliers contributed to a reduction of
operating costs and expenses by ¥280.0 billion. This was due to ¥220.0 billion in cost reduction efforts
concerning design related costs due mainly to ongoing value engineering activities, and ¥60.0 billion in cost
reduction efforts at plants and logistics department.
These cost reduction efforts related to ongoing value engineering and value analysis activities, the use of
common parts resulting in a reduction of part types and other manufacturing initiatives designed to reduce the
costs of vehicle production. The amount of the effect of cost reduction efforts includes the impact of fluctuation
in the price of steel, precious metals, non-ferrous alloys including aluminum, plastic parts and other production
materials and parts.
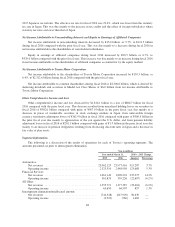
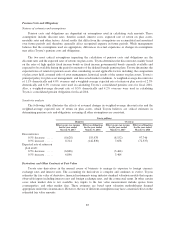
Cost of Products Sold
Cost of products sold increased by ¥928.1 billion, or 4.6%, to ¥20,916.3 billion during fiscal 2015 compared
with the prior fiscal year. The increase resulted mainly from the ¥691.0 billion unfavorable impact of fluctuations
in foreign currency translation rates, the ¥420.0 billion impact of changes in vehicle unit sales and sales mix, and
the ¥140.0 billion increase in product quality related expenses, partially offset by the ¥280.0 billion impact of
cost reduction efforts and the ¥80.0 billion costs related to ending the vehicle and engine production in Australia
recorded in the prior fiscal year.
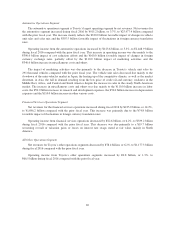
Cost of Financing Operations
Cost of financing operations increased by ¥112.4 billion, or 13.8%, to ¥925.3 billion during fiscal 2015
compared with the prior fiscal year. The increase resulted mainly from the ¥90.7 billion unfavorable impact of
fluctuations in foreign currency translation rates.
75