Toyota 2015 Annual Report Download - page 81
Download and view the complete annual report
Please find page 81 of the 2015 Toyota annual report below. You can navigate through the pages in the report by either clicking on the pages listed below, or by using the keyword search tool below to find specific information within the annual report.-
 1
1 -
2
-
3
-
4
-
5
-
6
-
7
-
8
-
9
-
10
-
11
-
12
-
13
-
14
-
15
-
16
-
17
-
18
-
19
-
20
-
21
-
22
-
23
-
24
-
25
-
26
-
27
-
28
-
29
-
30
-
31
-
32
-
33
-
34
-
35
-
36
-
37
-
38
-
39
-
40
-
41
-
42
-
43
-
44
-
45
-
46
-
47
-
48
-
49
-
50
-
51
-
52
-
53
-
54
-
55
-
56
-
57
-
58
-
59
-
60
-
61
-
62
-
63
-
64
-
65
-
66
-
67
-
68
-
69
-
70
-
 71
71 -
 72
72 -
 73
73 -
 74
74 -
 75
75 -
 76
76 -
 77
77 -
 78
78 -
 79
79 -
 80
80 -
 81
81 -
 82
82 -
 83
83 -
 84
84 -
 85
85 -
 86
86 -
 87
87 -
 88
88 -
 89
89 -
 90
90 -
 91
91 -
92
-
93
-
94
-
95
-
96
-
97
-
98
-
99
-
100
-
101
-
102
-
103
-
104
-
105
-
106
-
107
-
108
-
109
-
110
-
111
-
112
-
113
-
114
-
115
-
116
-
117
-
118
-
119
-
120
-
121
-
122
-
123
-
124
-
125
-
126
-
127
-
128
-
129
-
130
-
131
-
132
-
133
-
134
-
135
-
136
-
137
-
138
-
139
-
140
-
141
-
142
-
143
-
144
-
145
-
146
-
147
-
148
-
149
-
150
-
151
-
152
-
153
-
154
-
155
-
156
-
157
-
158
-
159
-
160
-
161
-
162
-
163
-
164
-
165
-
166
-
167
-
168
-
169
-
170
-
171
-
172
-
173
-
174
-
175
-
176
-
177
-
178
-
179
-
180
-
181
-
182
-
183
-
184
-
185
-
186
-
187
-
188
-
189
-
190
-
191
-
192
-
193
-
194
-
195
-
196
-
197
-
198
-
199
-
200
-
201
-
202
-
203
-
204
-
205
-
206
-
207
-
208
-
209
-
210
-
211
-
212
-
213
-
214
-
215
-
216
-
217
-
218
-
219
-
220
-
221
-
222
-
223
-
224
-
225
-
226
-
227
-
228
 |
 |

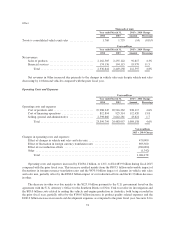
Selling, General and Administrative Expenses
Selling, general and administrative expenses increased by ¥43.6 billion, or 1.7%, to ¥2,642.2 billion during
fiscal 2015 compared with the prior fiscal year. This increase mainly reflected the ¥113.6 billion unfavorable
impact of fluctuations in foreign currency translation rates, partially offset by the ¥125.0 billion payment to the
U.S. government based on the agreement with the U.S. Attorney’s Office for the Southern District of New York
to resolve its investigation recorded in the prior fiscal year.
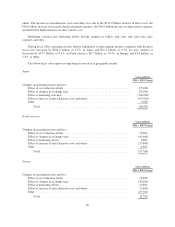
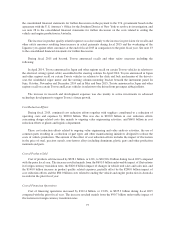
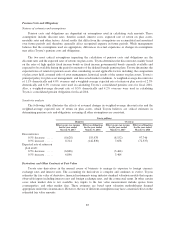
Operating Income
Yen in millions
2015 v. 2014 Change
Changes in operating income and loss:
Effect of changes in exchange rates .......................................... 280,000
Effect of cost reduction efforts .............................................. 280,000
Effect of marketing activities ............................................... (70,000)
Effect of increase of miscellaneous costs and others ............................. (160,000)
Other .................................................................. 128,452
Total .............................................................. 458,452
Toyota’s operating income increased by ¥458.4 billion, or 20.0%, to ¥2,750.5 billion during fiscal 2015
compared with the prior fiscal year. This increase was due mainly to the ¥280.0 billion favorable impact of
changes in foreign currency exchange rates, and ¥280.0 billion impact of cost reduction efforts, partially offset
by the ¥70.0 billion impact of marketing activities, and ¥160.0 billion increase in miscellaneous costs and others.
The increase in miscellaneous costs and others was due mainly to the ¥140.0 billion increase in product quality
related expenses, the ¥100.0 billion increase in research and development expenses, and ¥80.0 billion increase in
labor costs, partially offset by the ¥125.0 billion payment to the U.S. government based on the agreement with
the U.S. Attorney’s Office for the Southern District of New York to resolve its investigation and the ¥83.0 billion
costs related to ending the vehicle and engine production in Australia, both being recorded in the prior fiscal
year.
Marketing efforts and marketing activities include changes in vehicle unit sales and sales mix, sales
expenses and other.
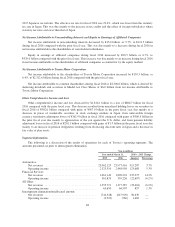
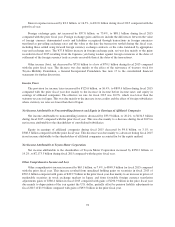
During fiscal 2015, operating income (before elimination of intersegment profits), compared with the prior
fiscal year increased by ¥61.3 billion, or 4.1%, in Japan, ¥258.4 billion, or 79.3%, in North America,
¥22.8 billion, or 39.3%, in Europe, ¥26.0 billion, or 6.6%, in Asia, and ¥68.9 billion, or 162.0%, in Other.
The following is a description of operating income in each geographic market.
Japan
Yen in millions
2015 v. 2014 Change
Changes in operating income and loss:
Effect of changes in exchange rates .......................................... 360,000
Effect of cost reduction efforts .............................................. 195,000
Effect of marketing activities ............................................... (270,000)
Effect of increase of miscellaneous costs and others ............................. (225,000)
Other .................................................................. 1,311
Total .............................................................. 61,311
76