Toyota 2015 Annual Report Download - page 192
Download and view the complete annual report
Please find page 192 of the 2015 Toyota annual report below. You can navigate through the pages in the report by either clicking on the pages listed below, or by using the keyword search tool below to find specific information within the annual report.-
 1
1 -
2
-
3
-
4
-
5
-
6
-
7
-
8
-
9
-
10
-
11
-
12
-
13
-
14
-
15
-
16
-
17
-
18
-
19
-
20
-
21
-
22
-
23
-
24
-
25
-
26
-
27
-
28
-
29
-
30
-
31
-
32
-
33
-
34
-
35
-
36
-
37
-
38
-
39
-
40
-
41
-
42
-
43
-
44
-
45
-
46
-
47
-
48
-
49
-
50
-
51
-
52
-
53
-
54
-
55
-
56
-
57
-
58
-
59
-
60
-
61
-
62
-
63
-
64
-
65
-
66
-
67
-
68
-
69
-
70
-
71
-
72
-
73
-
74
-
75
-
76
-
77
-
78
-
79
-
80
-
81
-
82
-
83
-
84
-
85
-
86
-
87
-
88
-
89
-
90
-
91
-
92
-
93
-
94
-
95
-
96
-
97
-
98
-
99
-
100
-
101
-
102
-
103
-
104
-
105
-
106
-
107
-
108
-
109
-
110
-
111
-
112
-
113
-
114
-
115
-
116
-
117
-
118
-
119
-
120
-
121
-
122
-
123
-
124
-
125
-
126
-
127
-
128
-
129
-
130
-
131
-
132
-
133
-
134
-
135
-
136
-
137
-
138
-
139
-
140
-
141
-
142
-
143
-
144
-
145
-
146
-
147
-
148
-
149
-
150
-
151
-
152
-
153
-
154
-
155
-
156
-
157
-
158
-
159
-
160
-
161
-
162
-
163
-
164
-
165
-
166
-
167
-
168
-
169
-
170
-
171
-
172
-
173
-
174
-
175
-
176
-
177
-
178
-
179
-
180
-
181
-
 182
182 -
 183
183 -
 184
184 -
 185
185 -
 186
186 -
 187
187 -
 188
188 -
 189
189 -
 190
190 -
 191
191 -
 192
192 -
 193
193 -
 194
194 -
 195
195 -
 196
196 -
 197
197 -
 198
198 -
 199
199 -
 200
200 -
 201
201 -
 202
202 -
203
-
204
-
205
-
206
-
207
-
208
-
209
-
210
-
211
-
212
-
213
-
214
-
215
-
216
-
217
-
218
-
219
-
220
-
221
-
222
-
223
-
224
-
225
-
226
-
227
-
228
 |
 |

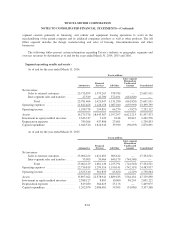
TOYOTA MOTOR CORPORATION
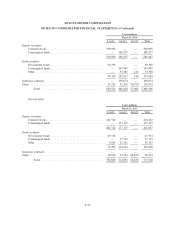
NOTES TO CONSOLIDATED FINANCIAL STATEMENTS—(Continued)
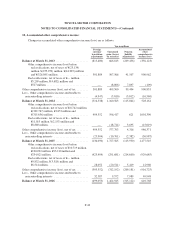
Yen in millions
March 31, 2016
Level 1 Level 2 Level 3 Total
Equity securities
Common stocks ....................................... 201,967 — — 201,967
Commingled funds ..................................... — 173,266 — 173,266
201,967 173,266 — 375,233
Debt securities
Government bonds ..................................... 75,222 — — 75,222
Commingled funds ..................................... — 84,130 — 84,130
Other ................................................ — 47,583 — 47,583
75,222 131,713 — 206,935
Insurance contracts ......................................... — — — —
Other .................................................... 12,566 15,308 82,759 110,633
Total ............................................ 289,755 320,287 82,759 692,801
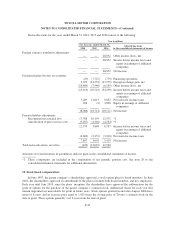
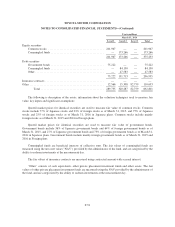
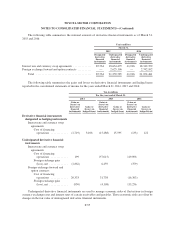
The following is description of the assets, information about the valuation techniques used to measure fair
value, key inputs and significant assumptions:
Quoted market prices for identical securities are used to measure fair value of common stocks. Common
stocks include 77% of Japanese stocks and 23% of foreign stocks as of March 31, 2015, and 75% of Japanese
stocks and 25% of foreign stocks as of March 31, 2016 in Japanese plans. Common stocks include mainly
foreign stocks as of March 31, 2015 and 2016 in Foreign plans.
Quoted market prices for identical securities are used to measure fair value of government bonds.
Government bonds include 36% of Japanese government bonds and 64% of foreign government bonds as of
March 31, 2015, and 27% of Japanese government bonds and 73% of foreign government bonds as of March 31,
2016 in Japanese plans. Government bonds include mainly foreign government bonds as of March 31, 2015 and
2016 in Foreign plans.
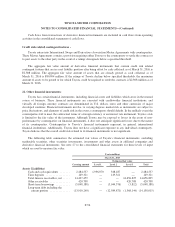
Commingled funds are beneficial interests of collective trust. The fair values of commingled funds are
measured using the net asset value (“NAV”) provided by the administrator of the fund, and are categorized by the
ability to redeem investments at the measurement day.
The fair values of insurance contracts are measured using contracted amount with accrued interest.
“Other” consists of cash equivalents, other private placement investment funds and other assets. The fair
values of other private placement investment funds are measured using the NAV provided by the administrator of
the fund, and are categorized by the ability to redeem investments at the measurement day.
F-51