Toyota 2015 Annual Report Download - page 94
Download and view the complete annual report
Please find page 94 of the 2015 Toyota annual report below. You can navigate through the pages in the report by either clicking on the pages listed below, or by using the keyword search tool below to find specific information within the annual report.-
 1
1 -
2
-
3
-
4
-
5
-
6
-
7
-
8
-
9
-
10
-
11
-
12
-
13
-
14
-
15
-
16
-
17
-
18
-
19
-
20
-
21
-
22
-
23
-
24
-
25
-
26
-
27
-
28
-
29
-
30
-
31
-
32
-
33
-
34
-
35
-
36
-
37
-
38
-
39
-
40
-
41
-
42
-
43
-
44
-
45
-
46
-
47
-
48
-
49
-
50
-
51
-
52
-
53
-
54
-
55
-
56
-
57
-
58
-
59
-
60
-
61
-
62
-
63
-
64
-
65
-
66
-
67
-
68
-
69
-
70
-
71
-
72
-
73
-
74
-
75
-
76
-
77
-
78
-
79
-
80
-
81
-
82
-
83
-
 84
84 -
 85
85 -
 86
86 -
 87
87 -
 88
88 -
 89
89 -
 90
90 -
 91
91 -
 92
92 -
 93
93 -
 94
94 -
 95
95 -
 96
96 -
 97
97 -
 98
98 -
 99
99 -
 100
100 -
 101
101 -
 102
102 -
 103
103 -
 104
104 -
105
-
106
-
107
-
108
-
109
-
110
-
111
-
112
-
113
-
114
-
115
-
116
-
117
-
118
-
119
-
120
-
121
-
122
-
123
-
124
-
125
-
126
-
127
-
128
-
129
-
130
-
131
-
132
-
133
-
134
-
135
-
136
-
137
-
138
-
139
-
140
-
141
-
142
-
143
-
144
-
145
-
146
-
147
-
148
-
149
-
150
-
151
-
152
-
153
-
154
-
155
-
156
-
157
-
158
-
159
-
160
-
161
-
162
-
163
-
164
-
165
-
166
-
167
-
168
-
169
-
170
-
171
-
172
-
173
-
174
-
175
-
176
-
177
-
178
-
179
-
180
-
181
-
182
-
183
-
184
-
185
-
186
-
187
-
188
-
189
-
190
-
191
-
192
-
193
-
194
-
195
-
196
-
197
-
198
-
199
-
200
-
201
-
202
-
203
-
204
-
205
-
206
-
207
-
208
-
209
-
210
-
211
-
212
-
213
-
214
-
215
-
216
-
217
-
218
-
219
-
220
-
221
-
222
-
223
-
224
-
225
-
226
-
227
-
228
 |
 |

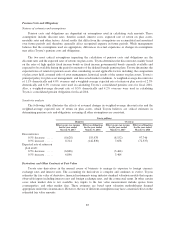
Property, plant and equipment increased during fiscal 2016 by ¥444.6 billion, or 4.8%, primarily reflecting
the increase in the capital expenditures.
Accounts and notes payable decreased during fiscal 2016 by ¥21.0 billion, or 0.9%. This decrease was due
mainly to the fluctuations in foreign currency translation rates.
Accrued expenses increased during fiscal 2016 by ¥57.4 billion, or 2.2%. This increase was due mainly to
the increase in accrued product quality related expenses.
Income taxes payable decreased during fiscal 2016 by ¥5.4 billion, or 1.6%.
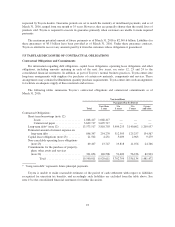
Toyota’s total borrowings decreased during fiscal 2016 by ¥684.7 billion, or 3.6%. Toyota’s short-term
borrowings consist of loans with a weighted-average interest rate of 2.05% and commercial paper with a
weighted-average interest rate of 0.71%. Short-term borrowings decreased during fiscal 2016 by ¥350.0 billion,
or 6.9%, to ¥4,698.1 billion. Toyota’s long-term debt consists of unsecured and secured loans, medium-term
notes, unsecured and secured notes etc. with weighted-average interest rates ranging from 1.11% to 8.58%, and
maturity dates ranging from 2016 to 2047. The current portion of long-term debt decreased during fiscal 2016 by
¥92.3 billion, or 2.4%, to ¥3,822.9 billion and the non-current portion decreased by ¥242.3 billion, or 2.4%, to
¥9,772.0 billion. The decrease in total borrowings resulted mainly from the fluctuations in foreign currency
translation rates. As of March 31, 2016, approximately 49% of long-term debt was denominated in U.S. dollars,
12% in Japanese yen, 9% in Australian dollars, and 30% in other currencies. Toyota hedges interest rate risk
exposure of fixed-rate borrowings by entering into interest rate swaps. There are no material seasonal variations
in Toyota’s borrowings requirements.
As of March 31, 2016, Toyota’s total interest bearing debt was 109.2% of Toyota Motor Corporation
shareholders’ equity, compared with 113.0% as of March 31, 2015.
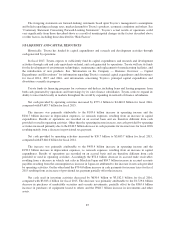
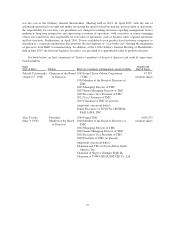
The following table provides information for credit rating of Toyota’s short-term borrowing and long-term
debt from rating agencies, Standard & Poor’s Ratings Group (S&P), Moody’s Investors Services (Moody’s), and
Rating and Investment Information, Inc. (R&I), as of May 31, 2016. A credit rating is not a recommendation to
buy, sell or hold securities. A credit rating may be subject to withdrawal or revision at any time. Each rating
should be evaluated separately of any other rating.
S&P Moody’s R&I
Short-term borrowing ..... A-1+ P-1 —
Long-term debt .......... AA- Aa3 AA+
Toyota’s unfunded pension liabilities of Japanese plans increased during fiscal 2016 by ¥269.4 billion, or
98.6%, to ¥542.9 billion. The liabilities of foreign plans increased during fiscal 2016 by ¥7.0 billion, or 2.7%, to
¥270.4 billion. The unfunded amounts will be funded through future cash contributions by Toyota or in some
cases will be settled on the retirement date of each covered employee. The increase in unfunded pension
liabilities of the Japanese plans reflects mainly an increase in pension benefit obligations that resulted from a
decline in discount rate. See note 20 to the consolidated financial statements for further discussion.
Toyota’s treasury policy is to maintain controls on all exposures, to adhere to stringent counterparty credit
standards, and to actively monitor marketplace exposures. Toyota remains centralized, and is pursuing global
efficiency of its financial services operations through Toyota Financial Services Corporation.
The key element of Toyota’s financial strategy is maintaining a strong financial position that will allow
Toyota to fund its research and development initiatives, capital expenditures and financial services operations
efficiently even if earnings are subject to short-term fluctuations. Toyota believes that it maintains sufficient
89