Toyota 2015 Annual Report Download - page 62
Download and view the complete annual report
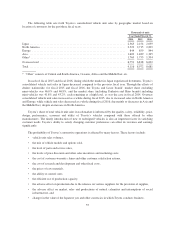
Please find page 62 of the 2015 Toyota annual report below. You can navigate through the pages in the report by either clicking on the pages listed below, or by using the keyword search tool below to find specific information within the annual report.-
 1
1 -
2
-
3
-
4
-
5
-
6
-
7
-
8
-
9
-
10
-
11
-
12
-
13
-
14
-
15
-
16
-
17
-
18
-
19
-
20
-
21
-
22
-
23
-
24
-
25
-
26
-
27
-
28
-
29
-
30
-
31
-
32
-
33
-
34
-
35
-
36
-
37
-
38
-
39
-
40
-
41
-
42
-
43
-
44
-
45
-
46
-
47
-
48
-
49
-
50
-
51
-
 52
52 -
 53
53 -
 54
54 -
 55
55 -
 56
56 -
 57
57 -
 58
58 -
 59
59 -
 60
60 -
 61
61 -
 62
62 -
 63
63 -
 64
64 -
 65
65 -
 66
66 -
 67
67 -
 68
68 -
 69
69 -
 70
70 -
 71
71 -
 72
72 -
73
-
74
-
75
-
76
-
77
-
78
-
79
-
80
-
81
-
82
-
83
-
84
-
85
-
86
-
87
-
88
-
89
-
90
-
91
-
92
-
93
-
94
-
95
-
96
-
97
-
98
-
99
-
100
-
101
-
102
-
103
-
104
-
105
-
106
-
107
-
108
-
109
-
110
-
111
-
112
-
113
-
114
-
115
-
116
-
117
-
118
-
119
-
120
-
121
-
122
-
123
-
124
-
125
-
126
-
127
-
128
-
129
-
130
-
131
-
132
-
133
-
134
-
135
-
136
-
137
-
138
-
139
-
140
-
141
-
142
-
143
-
144
-
145
-
146
-
147
-
148
-
149
-
150
-
151
-
152
-
153
-
154
-
155
-
156
-
157
-
158
-
159
-
160
-
161
-
162
-
163
-
164
-
165
-
166
-
167
-
168
-
169
-
170
-
171
-
172
-
173
-
174
-
175
-
176
-
177
-
178
-
179
-
180
-
181
-
182
-
183
-
184
-
185
-
186
-
187
-
188
-
189
-
190
-
191
-
192
-
193
-
194
-
195
-
196
-
197
-
198
-
199
-
200
-
201
-
202
-
203
-
204
-
205
-
206
-
207
-
208
-
209
-
210
-
211
-
212
-
213
-
214
-
215
-
216
-
217
-
218
-
219
-
220
-
221
-
222
-
223
-
224
-
225
-
226
-
227
-
228
 |
 |

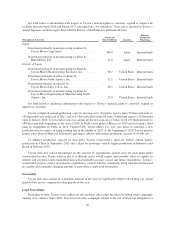
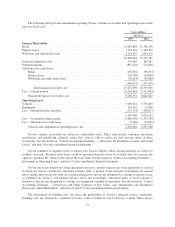
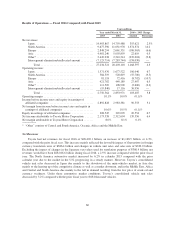
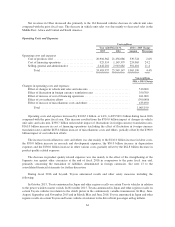
The following table provides information regarding Toyota’s finance receivables and operating leases in the
past two fiscal years.
Yen in millions
March 31,
2015 2016
Finance Receivables
Retail ................................................................ 12,015,844 11,156,798
Finance leases ......................................................... 1,158,361 1,144,312
Wholesale and other dealer loans .......................................... 3,124,079 2,994,171
16,298,284 15,295,281
Deferred origination costs ................................................ 179,905 169,467
Unearned income ....................................................... (837,124) (754,836)
Allowance for credit losses
Retail ............................................................ (109,316) (98,853)
Finance leases ..................................................... (29,303) (24,600)
Wholesale and other dealer loans ...................................... (30,053) (30,828)
(168,672) (154,281)
Total finance receivables, net ..................................... 15,472,393 14,555,631
Less – Current portion ................................................... (6,269,862) (5,912,684)
Noncurrent finance receivables, net .................................... 9,202,531 8,642,947
Operating Leases
Vehicles .............................................................. 5,169,524 5,778,463
Equipment ............................................................ 163,195 12,836
Less – Deferred income and other .......................................... (132,733) (138,677)
5,199,986 5,652,622
Less – Accumulated depreciation .......................................... (1,080,936) (1,133,785)
Less – Allowance for credit losses ......................................... (9,366) (13,049)
Vehicles and equipment on operating leases, net .......................... 4,109,684 4,505,788
Toyota’s finance receivables are subject to collectability risks. These risks include consumer and dealer
insolvencies and insufficient collateral values (less costs to sell) to realize the full carrying values of these
receivables. See discussion in “Critical Accounting Estimates — Allowance for Doubtful Accounts and Credit
Losses” and note 10 to the consolidated financial statements.
Toyota continues to originate leases to finance new Toyota vehicles. These leasing activities are subject to
residual value risk. Residual value losses could be incurred when the lessee of a vehicle does not exercise the
option to purchase the vehicle at the end of the lease term. See discussion in “Critical Accounting Estimates —
Investment in Operating Leases” and note 2 to the consolidated financial statements.
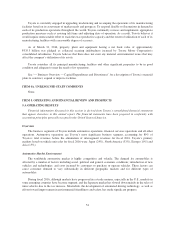
Toyota enters into interest rate swap agreements and cross currency interest rate swap agreements to convert
its fixed-rate debt to variable-rate functional currency debt. A portion of the derivative instruments are entered
into to hedge interest rate risk from an economic perspective and are not designated as a hedge of specific assets
or liabilities on Toyota’s consolidated balance sheet and accordingly, unrealized gains or losses related to
derivatives that are not designated as a hedge are recognized currently in operations. See discussion in “Critical
Accounting Estimates — Derivatives and Other Contracts at Fair Value” and “Quantitative and Qualitative
Disclosures about Market Risk” and notes 21 and 27 to the consolidated financial statements.
The fluctuations in funding costs can affect the profitability of Toyota’s financial services operations.
Funding costs are affected by a number of factors, some of which are not in Toyota’s control. These factors
57