Toyota 2015 Annual Report Download - page 170
Download and view the complete annual report
Please find page 170 of the 2015 Toyota annual report below. You can navigate through the pages in the report by either clicking on the pages listed below, or by using the keyword search tool below to find specific information within the annual report.-
 1
1 -
2
-
3
-
4
-
5
-
6
-
7
-
8
-
9
-
10
-
11
-
12
-
13
-
14
-
15
-
16
-
17
-
18
-
19
-
20
-
21
-
22
-
23
-
24
-
25
-
26
-
27
-
28
-
29
-
30
-
31
-
32
-
33
-
34
-
35
-
36
-
37
-
38
-
39
-
40
-
41
-
42
-
43
-
44
-
45
-
46
-
47
-
48
-
49
-
50
-
51
-
52
-
53
-
54
-
55
-
56
-
57
-
58
-
59
-
60
-
61
-
62
-
63
-
64
-
65
-
66
-
67
-
68
-
69
-
70
-
71
-
72
-
73
-
74
-
75
-
76
-
77
-
78
-
79
-
80
-
81
-
82
-
83
-
84
-
85
-
86
-
87
-
88
-
89
-
90
-
91
-
92
-
93
-
94
-
95
-
96
-
97
-
98
-
99
-
100
-
101
-
102
-
103
-
104
-
105
-
106
-
107
-
108
-
109
-
110
-
111
-
112
-
113
-
114
-
115
-
116
-
117
-
118
-
119
-
120
-
121
-
122
-
123
-
124
-
125
-
126
-
127
-
128
-
129
-
130
-
131
-
132
-
133
-
134
-
135
-
136
-
137
-
138
-
139
-
140
-
141
-
142
-
143
-
144
-
145
-
146
-
147
-
148
-
149
-
150
-
151
-
152
-
153
-
154
-
155
-
156
-
157
-
158
-
159
-
 160
160 -
 161
161 -
 162
162 -
 163
163 -
 164
164 -
 165
165 -
 166
166 -
 167
167 -
 168
168 -
 169
169 -
 170
170 -
 171
171 -
 172
172 -
 173
173 -
 174
174 -
 175
175 -
 176
176 -
 177
177 -
 178
178 -
 179
179 -
 180
180 -
181
-
182
-
183
-
184
-
185
-
186
-
187
-
188
-
189
-
190
-
191
-
192
-
193
-
194
-
195
-
196
-
197
-
198
-
199
-
200
-
201
-
202
-
203
-
204
-
205
-
206
-
207
-
208
-
209
-
210
-
211
-
212
-
213
-
214
-
215
-
216
-
217
-
218
-
219
-
220
-
221
-
222
-
223
-
224
-
225
-
226
-
227
-
228
 |
 |

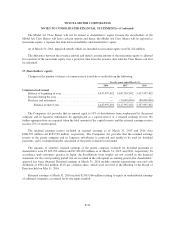
TOYOTA MOTOR CORPORATION
NOTES TO CONSOLIDATED FINANCIAL STATEMENTS—(Continued)
Yen in millions
For the year ended March 31, 2016
Retail Finance leases
Wholesale and
other dealer
loans
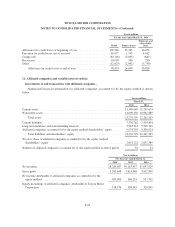
Allowance for credit losses at beginning of year .................... 109,316 29,303 30,053
Provision for credit losses, net of reversal ......................... 65,677 1,742 4,962
Charge-offs ................................................. (83,116) (3,833) (667)
Recoveries .................................................. 18,999 380 230
Other ...................................................... (12,023) (2,992) (3,750)
Allowance for credit losses at end of year ..................... 98,853 24,600 30,828
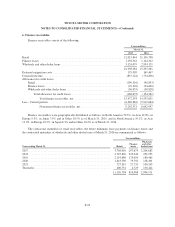
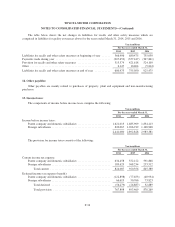
11. Affiliated companies and variable interest entities:
Investments in and transactions with affiliated companies -
Summarized financial information for affiliated companies accounted for by the equity method is shown
below:
Yen in millions
March 31,
2015 2016
Current assets ........................................................... 11,380,649 11,299,674
Noncurrent assets ........................................................ 11,890,150 10,961,889
Total assets ........................................................ 23,270,799 22,261,563
Current liabilities ........................................................ 7,330,762 7,414,894
Long-term liabilities and noncontrolling interests .............................. 5,965,242 5,509,745
Affiliated companies accounted for by the equity method shareholders’ equity ....... 9,974,795 9,336,924
Total liabilities and shareholders’ equity ................................. 23,270,799 22,261,563
Toyota’s share of affiliated companies accounted for by the equity method
shareholders’ equity .................................................... 2,691,222 2,631,389
Number of affiliated companies accounted for by the equity method at end of period . . 54 54
Yen in millions
For the years ended March 31,
2014 2015 2016
Net revenues ............................................... 28,289,687 30,163,457 31,037,029
Gross profit ................................................ 3,385,048 3,614,946 3,852,899
Net income attributable to affiliated companies accounted for by the
equity method ............................................ 963,003 966,133 957,742
Equity in earnings of affiliated companies attributable to Toyota Motor
Corporation .............................................. 318,376 308,545 329,099
F-29