Verizon Wireless 2006 Annual Report Download - page 19
Download and view the complete annual report
Please find page 19 of the 2006 Verizon Wireless annual report below. You can navigate through the pages in the report by either clicking on the pages listed below, or by using the keyword search tool below to find specific information within the annual report.-
 1
1 -
2
-
3
-
4
-
5
-
6
-
7
-
8
-
 9
9 -
 10
10 -
 11
11 -
 12
12 -
 13
13 -
 14
14 -
 15
15 -
 16
16 -
 17
17 -
 18
18 -
 19
19 -
 20
20 -
 21
21 -
 22
22 -
 23
23 -
 24
24 -
 25
25 -
 26
26 -
 27
27 -
 28
28 -
 29
29 -
30
-
31
-
32
-
33
-
34
-
35
-
36
-
37
-
38
-
39
-
40
-
41
-
42
-
43
-
44
-
45
-
46
-
47
-
48
-
49
-
50
-
51
-
52
-
53
-
54
-
55
-
56
-
57
-
58
-
59
-
60
-
61
-
62
-
63
-
64
-
65
-
66
-
67
-
68
-
69
-
70
-
71
-
72
-
73
-
74
-
75
-
76
-
77
-
78
-
79
-
80
-
81
-
82
-
83
-
84
 |
 |
17
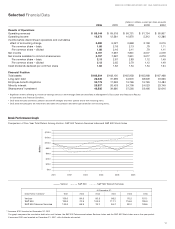
(dollars in millions, except per share amounts)
2006 2005 2004 2003 2002
Results of Operations
Operating revenues $88,144 $69,518 $ 65,751 $ 61,754 $ 60,907
Operating income 13,373 12,581 10,870 5,312 12,386
Income before discontinued operations and cumulative
effect of accounting change 5,480 6,027 5,899 2,168 3,016
Per common share – basic 1.88 2.18 2.13 .79 1.11
Per common share – diluted 1.88 2.16 2.11 .79 1.11
Net income 6,197 7,397 7,831 3,077 4,079
Net income available to common shareowners 6,197 7,397 7,831 3,077 4,079
Per common share – basic 2.13 2.67 2.83 1.12 1.49
Per common share – diluted 2.12 2.65 2.79 1.12 1.49
Cash dividends declared per common share 1.62 1.62 1.54 1.54 1.54
Financial Position
Total assets $188,804 $168,130 $165,958 $165,968 $167,468
Long-term debt 28,646 31,569 34,970 38,609 43,066
Employee benefit obligations 30,779 17,693 16,796 15,726 14,484
Minority interest 28,337 26,433 24,709 24,023 23,749
Shareowners’ investment 48,535 39,680 37,560 33,466 32,616
•Significant events affecting our historical earnings trends in 2004 through 2006 are described in Management’s Discussion and Analysis of Results
of Operations and Financial Condition.
•2003 data includes severance, pension and benefit charges and other special and/or non-recurring items.
•2002 data includes gains on investments and sales of businesses and other special and/or non-recurring items.
Selected Financial Data
VERIZON COMMUNICATIONS INC. AND SUBSIDIARIES
$0.0
$20.0
$40.0
$60.0
$80.0
$100.0
$120.0
$140.0
2001 2002 2003 2004 2005 2006
Verizon S&P 500 S&P 500 Telecom Services
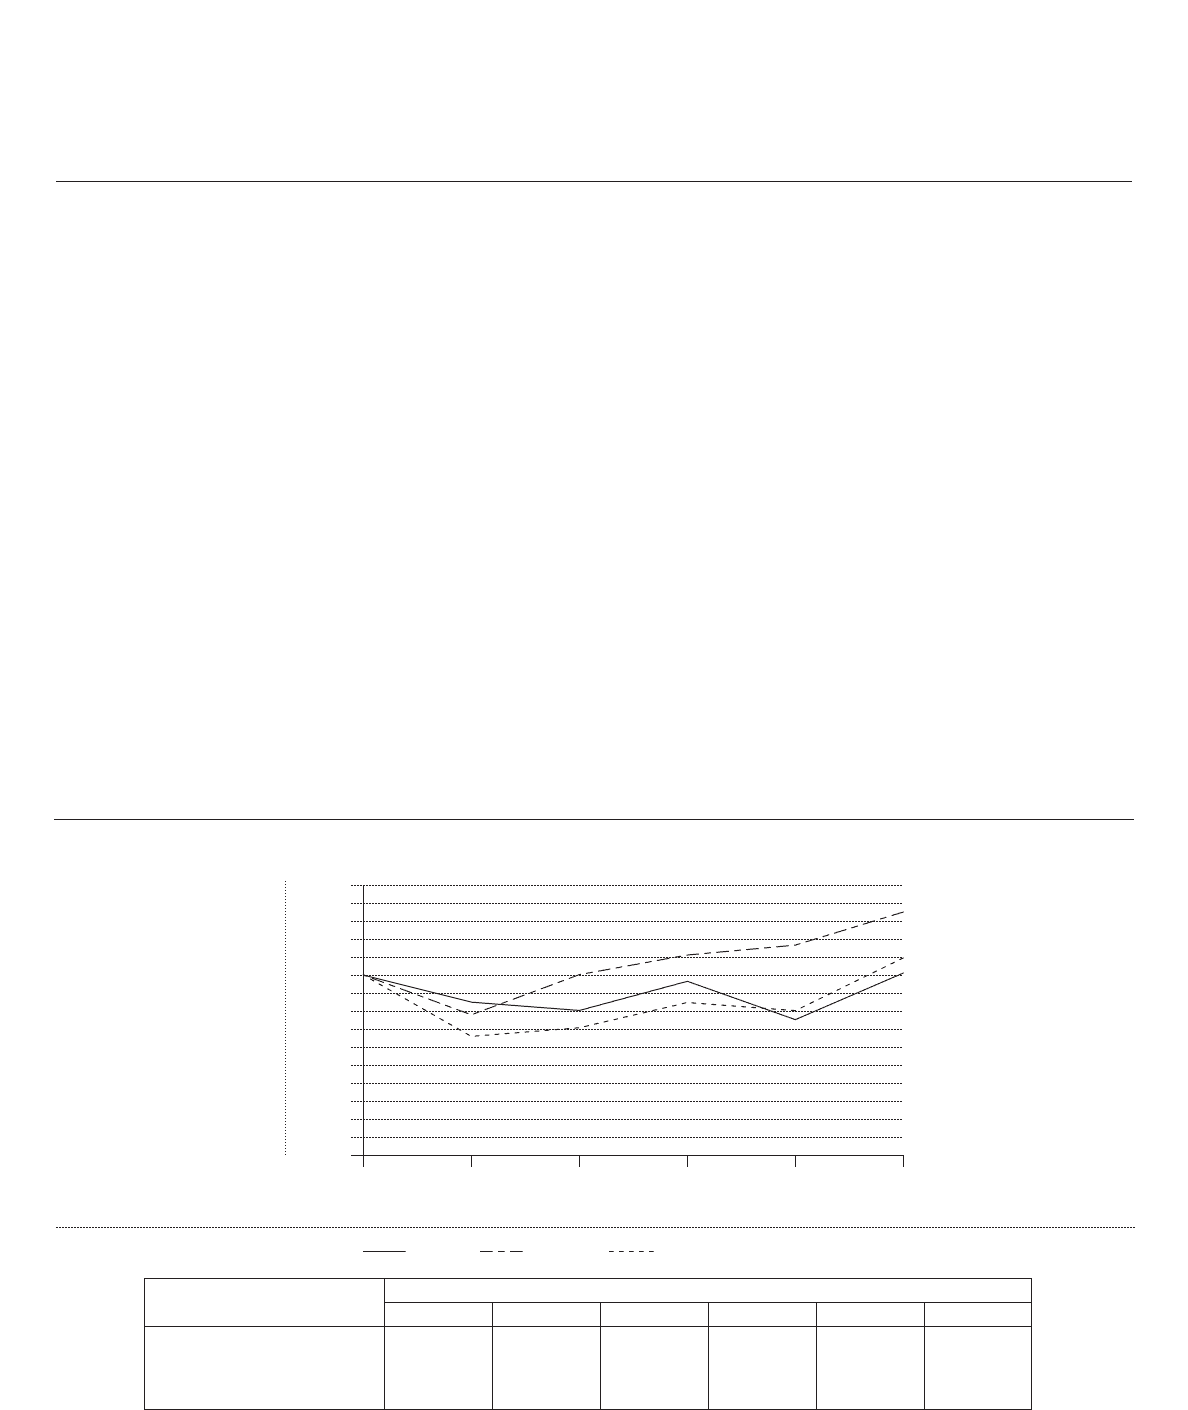
Stock Performance Graph
Dollars
Comparison of Five-Year Total Return Among Verizon, S&P 500 Telecom Services Index and S&P 500 Stock Index
*Assumes $100 invested on December 31, 2001
The graph compares the cumulative total returns of Verizon, the S&P 500 Telecommunications Services Index, and the S&P 500 Stock Index over a five-year period.
It assumes $100 was invested on December 31, 2001, with dividends reinvested.
At December 31,
Data Points in Dollars* 2001 2002 2003 2004 2005 2006
Verizon 100.0 84.9 80.3 96.5 75.2 101.1
S&P 500 100.0 77.9 100.2 111.1 116.6 135.0
S&P 500 Telecom Services 100.0 65.9 70.7 84.7 80.2 109.5