Verizon Wireless 2006 Annual Report Download - page 45
Download and view the complete annual report
Please find page 45 of the 2006 Verizon Wireless annual report below. You can navigate through the pages in the report by either clicking on the pages listed below, or by using the keyword search tool below to find specific information within the annual report.-
 1
1 -
2
-
3
-
4
-
5
-
6
-
7
-
8
-
9
-
10
-
11
-
12
-
13
-
14
-
15
-
16
-
17
-
18
-
19
-
20
-
21
-
22
-
23
-
24
-
25
-
26
-
27
-
28
-
29
-
30
-
31
-
32
-
33
-
34
-
 35
35 -
 36
36 -
 37
37 -
 38
38 -
 39
39 -
 40
40 -
 41
41 -
 42
42 -
 43
43 -
 44
44 -
 45
45 -
 46
46 -
 47
47 -
 48
48 -
 49
49 -
 50
50 -
 51
51 -
 52
52 -
 53
53 -
 54
54 -
 55
55 -
56
-
57
-
58
-
59
-
60
-
61
-
62
-
63
-
64
-
65
-
66
-
67
-
68
-
69
-
70
-
71
-
72
-
73
-
74
-
75
-
76
-
77
-
78
-
79
-
80
-
81
-
82
-
83
-
84
 |
 |

43
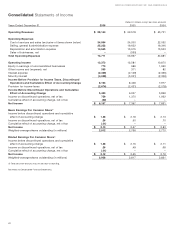
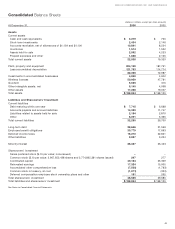
Consolidated Balance Sheets
VERIZON COMMUNICATIONS INC. AND SUBSIDIARIES
(dollars in millions, except per share amounts)
At December 31, 2006 2005
Assets
Current assets
Cash and cash equivalents $3,219 $760
Short-term investments 2,434 2,146
Accounts receivable, net of allowances of $1,139 and $1,100 10,891 8,534
Inventories 1,514 1,522
Assets held for sale 2,592 4,233
Prepaid expenses and other 1,888 2,125
Total current assets 22,538 19,320
Plant, property and equipment 204,109 187,761
Less accumulated depreciation 121,753 114,774
82,356 72,987
Investments in unconsolidated businesses 4,868 4,602
Wireless licenses 50,959 47,781
Goodwill 5,655 315
Other intangible assets, net 5,140 4,068
Other assets 17,288 19,057
Total assets $188,804 $168,130
Liabilities and Shareowners’ Investment
Current liabilities
Debt maturing within one year $7,715 $6,688
Accounts payable and accrued liabilities 14,320 11,747
Liabilities related to assets held for sale 2,154 2,870
Other 8,091 5,395
Total current liabilities 32,280 26,700
Long-term debt 28,646 31,569
Employee benefit obligations 30,779 17,693
Deferred income taxes 16,270 22,831
Other liabilities 3,957 3,224
Minority interest 28,337 26,433
Shareowners’ investment
Series preferred stock ($.10 par value; none issued) ––
Common stock ($.10 par value; 2,967,652,438 shares and 2,774,865,381 shares issued) 297 277
Contributed capital 40,124 25,369
Reinvested earnings 17,324 15,905
Accumulated other comprehensive loss (7,530) (1,783)
Common stock in treasury, at cost (1,871) (353)
Deferred compensation-employee stock ownership plans and other 191 265
Total shareowners’ investment 48,535 39,680
Total liabilities and shareowners’ investment $188,804 $168,130
See Notes to Consolidated Financial Statements.