Verizon Wireless 2006 Annual Report Download - page 70
Download and view the complete annual report
Please find page 70 of the 2006 Verizon Wireless annual report below. You can navigate through the pages in the report by either clicking on the pages listed below, or by using the keyword search tool below to find specific information within the annual report.-
 1
1 -
2
-
3
-
4
-
5
-
6
-
7
-
8
-
9
-
10
-
11
-
12
-
13
-
14
-
15
-
16
-
17
-
18
-
19
-
20
-
21
-
22
-
23
-
24
-
25
-
26
-
27
-
28
-
29
-
30
-
31
-
32
-
33
-
34
-
35
-
36
-
37
-
38
-
39
-
40
-
41
-
42
-
43
-
44
-
45
-
46
-
47
-
48
-
49
-
50
-
51
-
52
-
53
-
54
-
55
-
56
-
57
-
58
-
59
-
 60
60 -
 61
61 -
 62
62 -
 63
63 -
 64
64 -
 65
65 -
 66
66 -
 67
67 -
 68
68 -
 69
69 -
 70
70 -
 71
71 -
 72
72 -
 73
73 -
 74
74 -
 75
75 -
 76
76 -
 77
77 -
 78
78 -
 79
79 -
 80
80 -
81
-
82
-
83
-
84
 |
 |

68
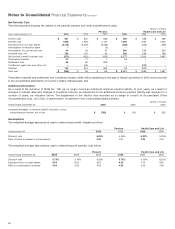
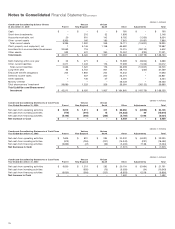
Severance Benefits
The following table provides an analysis of our severance liability
recorded in accordance with SFAS Nos. 112 and 146:
(dollars in millions)
Beginning Charged to
Year of Year Expense Payments Other End of Year
2004 $ 2,150 $ (40) $ (1,356) $ (1) $ 753
2005 753 99 (251) (5) 596
2006 596 343 (383) 88 644
The remaining severance liability includes future contractual pay-
ments to employees separated as of December 31, 2006. The 2006
expense includes charges for the involuntary separation of 4,100
employees (see Note 4).
NOTE 16
INCOME TAXES
The components of Income Before Provision for Income Taxes,
Discontinued Operations and Cumulative Effect of Accounting
Change are as follows:
(dollars in millions)
Years Ended December 31, 2006 2005 2004
Domestic $6,682 $7,496 $ 6,186
Foreign 1,472 952 1,791
$8,154 $8,448 $ 7,977
The components of the provision for income taxes from continuing
operations are as follows:
(dollars in millions)
Years Ended December 31, 2006 2005 2004
Current
Federal $2,364 $2,772 $ (162)
Foreign 141 81 249
State and local 420 661 271
2,925 3,514 358
Deferred
Federal (9) (844) 1,580
Foreign (45) (55) 53
State and local (190) (187) 95
(244) (1,086) 1,728
Investment tax credits (7) (7) (8)
Total income tax expense $2,674 $2,421 $ 2,078
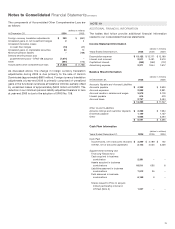
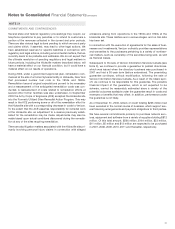
The following table shows the principal reasons for the difference
between the effective income tax rate and the statutory federal
income tax rate:
Years Ended December 31, 2006 2005 2004
Statutory federal income tax rate 35.0% 35.0% 35.0%
State and local income tax,
net of federal tax benefits 1.8 3.6 3.0
Tax benefits from investment losses (.9) (4.5) (3.7)
Equity in earnings from
unconsolidated businesses (3.8) (3.5) (8.0)
Other, net .7 (1.9) (.2)
Effective income tax rate 32.8% 28.7% 26.1%
The favorable impact on our 2006 effective income tax rate was pri-
marily driven by earnings from our unconsolidated businesses and tax
benefits from valuation allowance reversals. These favorable impacts
to the 2006 effective tax rate were partially offset by the unfavorable
impact of tax reserve adjustments which is included in the Other, net
line above. During 2006, we recorded a tax benefit of $80 million in
connection with capital gains and prior year investment losses.
During 2005, we recorded a tax benefit of $336 million in connec-
tion with capital gains and prior year investment losses. As a result
of the capital gain realized in 2005 in connection with the sale of our
Hawaii businesses, we recorded a tax benefit of $242 million related
to prior year investment losses. Also during 2005, we recorded a
net tax provision of $206 million related to the repatriation of foreign
earnings under the provisions of the American Jobs Creation Act of
2004, which provides for a favorable federal income tax rate in con-
nection with the repatriation of foreign earnings, provided the
criteria described in the law is met. Two of our foreign investments
repatriated earnings resulting in income taxes of $332 million, par-
tially offset by a tax benefit of $126 million.
The favorable impact on our 2004 effective income tax rate was pri-
marily driven by increased earnings from our unconsolidated
businesses and tax benefits from valuation allowance reversals.
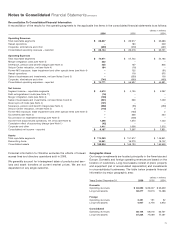
Deferred taxes arise because of differences in the book and tax
bases of certain assets and liabilities. Significant components of
deferred tax liabilities (assets) are shown in the following table:
(dollars in millions)
At December 31, 2006 2005
Employee benefits $(7,788) $(1,778)
Loss on investments (124) (369)
Former MCI tax loss carry forwards (2,026) –
Uncollectible accounts receivable (455) (375)
(10,393) (2,522)
Valuation allowance 2,600 815
Deferred tax assets (7,793) (1,707)
Former MCI intercompany
accounts receivable basis difference 2,003 –
Depreciation 7,617 9,676
Leasing activity 2,638 3,001
Wireless joint venture including
wireless licenses 12,177 11,786
Other – net 782 (370)
Deferred tax liabilities 25,217 24,093
Net deferred tax liability $17,424 $22,386
Net long-term deferred tax liabilities $16,270 $22,831
Plus net current deferred tax liabilities
(in Other current liabilities) 1,154 –
Less net current deferred tax assets
(in Prepaid expenses and other) –445
Net deferred tax liability $17,424 $22,386
At December 31, 2006, employee benefits deferred tax assets
include $5,174 million as a result of the adoption of SFAS No. 158
(see Note 15).
At December 31, 2006, undistributed earnings of our foreign sub-
sidiaries amounted to approximately $3 billion. Deferred income
taxes are not provided on these earnings as it is intended that the
Notes to Consolidated Financial Statements continued