Verizon Wireless 2006 Annual Report Download - page 47
Download and view the complete annual report
Please find page 47 of the 2006 Verizon Wireless annual report below. You can navigate through the pages in the report by either clicking on the pages listed below, or by using the keyword search tool below to find specific information within the annual report.-
 1
1 -
2
-
3
-
4
-
5
-
6
-
7
-
8
-
9
-
10
-
11
-
12
-
13
-
14
-
15
-
16
-
17
-
18
-
19
-
20
-
21
-
22
-
23
-
24
-
25
-
26
-
27
-
28
-
29
-
30
-
31
-
32
-
33
-
34
-
35
-
36
-
 37
37 -
 38
38 -
 39
39 -
 40
40 -
 41
41 -
 42
42 -
 43
43 -
 44
44 -
 45
45 -
 46
46 -
 47
47 -
 48
48 -
 49
49 -
 50
50 -
 51
51 -
 52
52 -
 53
53 -
 54
54 -
 55
55 -
 56
56 -
 57
57 -
58
-
59
-
60
-
61
-
62
-
63
-
64
-
65
-
66
-
67
-
68
-
69
-
70
-
71
-
72
-
73
-
74
-
75
-
76
-
77
-
78
-
79
-
80
-
81
-
82
-
83
-
84
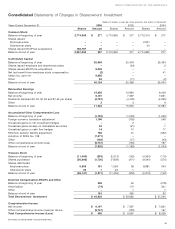
 |
 |

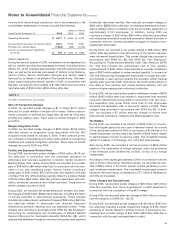
(dollars in millions, except per share amounts, and shares in thousands)
Years Ended December 31, 2006 2005 2004
Shares Amount Shares Amount Shares Amount
Common Stock
Balance at beginning of year 2,774,865 $ 277 2,774,865 $ 277 2,772,314 $ 277
Shares issued
Employee plans ––––2,501 –
Shareowner plans ––––50–
Shares issued MCI/Price acquisitions 192,787 20 ––––
Balance at end of year 2,967,652 297 2,774,865 277 2,774,865 277
Contributed Capital
Balance at beginning of year 25,369 25,404 25,363
Shares issued-employee and shareowner plans –(24) 2
Shares issued-MCI/Price acquisitions 6,009 ––
Net tax benefit from employee stock compensation (2) –41
Idearc Inc. spin-off 8,695 ––
Other 53 (11) (2)
Balance at end of year 40,124 25,369 25,404
Reinvested Earnings
Balance at beginning of year 15,905 12,984 9,409
Net income 6,197 7,397 7,831
Dividends declared ($1.62, $1.62 and $1.54 per share) (4,781) (4,479) (4,265)
Other 339
Balance at end of year 17,324 15,905 12,984
Accumulated Other Comprehensive Loss
Balance at beginning of year (1,783) (1,053) (1,250)
Foreign currency translation adjustment 1,196 (755) 548
Unrealized gains on net investment hedges –2–
Unrealized gains (losses) on marketable securities 54 (21) 7
Unrealized gains on cash flow hedges 14 10 17
Minimum pension liability adjustment 788 51 (332)
Adoption of SFAS No. 158 (7,671) ––
Other (128) (17) (43)
Other comprehensive income (loss) (5,747) (730) 197
Balance at end of year (7,530) (1,783) (1,053)
Treasury Stock
Balance at beginning of year (11,456) (353) (5,213) (142) (4,554) (115)
Shares purchased (50,066) (1,700) (7,859) (271) (9,540) (370)
Shares distributed
Employee plans 5,355 181 1,594 59 8,881 343
Shareowner plans 20 1 22 1 – –
Balance at end of year (56,147) (1,871) (11,456) (353) (5,213) (142)
Deferred Compensation–ESOPs and Other
Balance at beginning of year 265 90 (218)
Amortization (74) 174 301
Other –17
Balance at end of year 191 265 90
Total Shareowners’ Investment $ 48,535 $39,680 $ 37,560
Comprehensive Income
Net income $6,197 $7,397 $ 7,831
Other comprehensive income (loss) per above (5,747) (730) 197
Total Comprehensive Income (Loss) $ 450 $6,667 $ 8,028
See Notes to Consolidated Financial Statements.
Consolidated Statements of Changes in Shareowners’ Investment
45
VERIZON COMMUNICATIONS INC. AND SUBSIDIARIES